
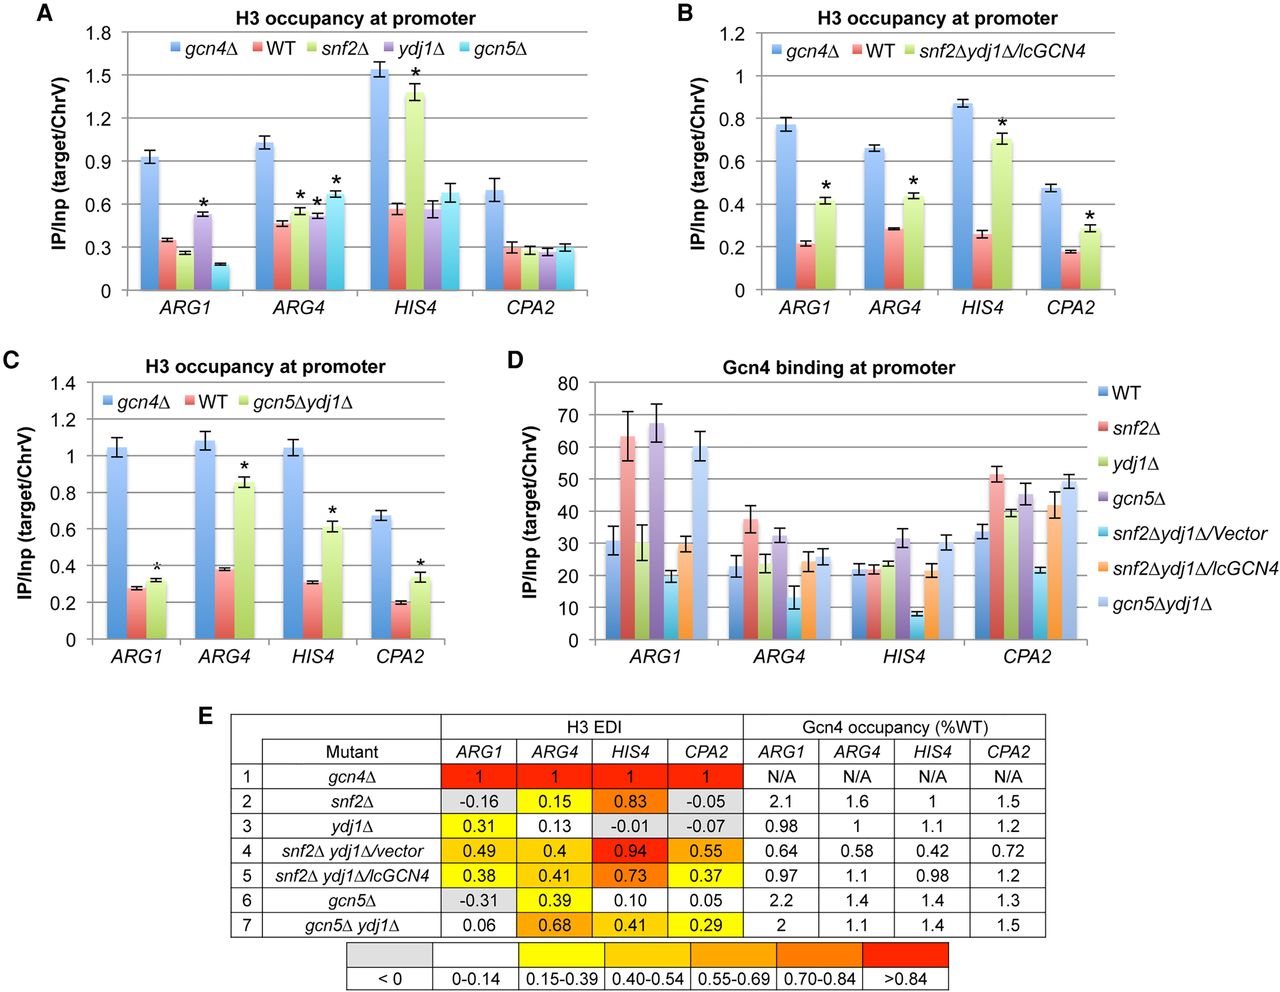
Snf2, Gcn5, and Ydj1 cooperate in H3 eviction from promoters of four Gcn4 target genes. (A–D) Conventional ChIP analysis of H3 (A–C) or Gcn4 (D) under inducing conditions, as in Supplemental Figure S1. Mean (±SD) values from three or more biological replicates; Student's t-tests identify significant differences [(*) P < 0.01]. (E) Mean H3 eviction defect indices (EDIs) were calculated as in Supplemental Figure S3A from experiments summarized in Supplemental Figure S4A and color-coded, with all SEMs <20% of mean values. Gcn4 occupancies were determined from replicate experiments conducted as in D and summarized in Supplemental Figure S4B. Occupancies in each mutant were normalized to those in WT cells, and mean normalized occupancies were calculated from three or more replicates, with all SEMs <20% of mean values. (N/A) Not applicable. These data appear in Supplemental Figure S3A,B and are duplicated here for comparison.


