
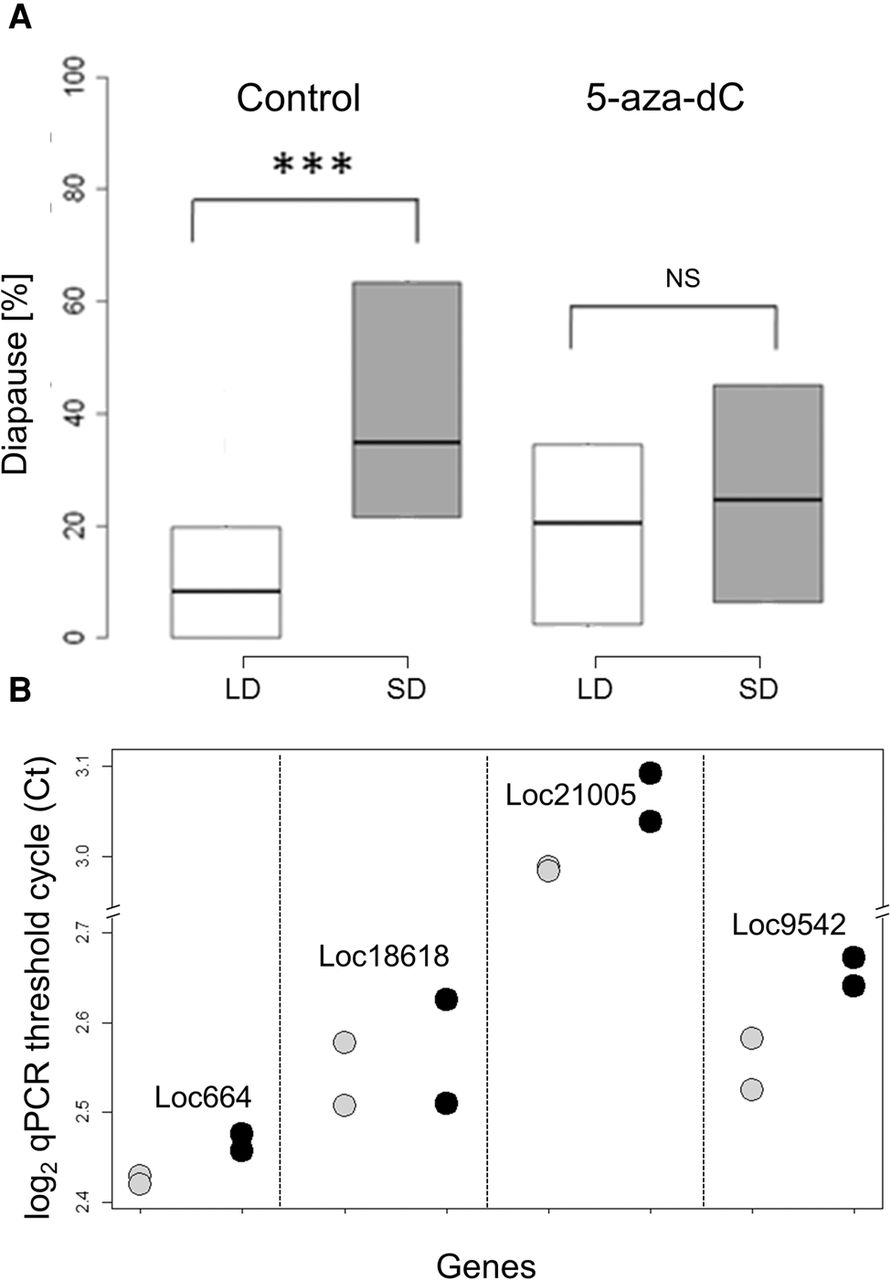
Figure 4.
Blocking DNA methylation by 5-aza-dC. (A) Control females (n = 81) fed by sucrose solution exhibit the normal increased diapause in short day (SD, gray box) compared to long day (LD, light, white box), whereas females fed with 10 µM 5-aza-dC (n = 79) show aberrant photoperiodic response: (***) P < 0.01; (NS) not significant. (B) Reduction in the level of CpG methylation after drug treatment. The qPCR threshold cycle (log2 Ct) values for control (gray circles) and drug-treated groups (black circles) is shown for four different loci. A clear increase (in three of the four loci) in Ct indicates reduced methylation (see text).


