
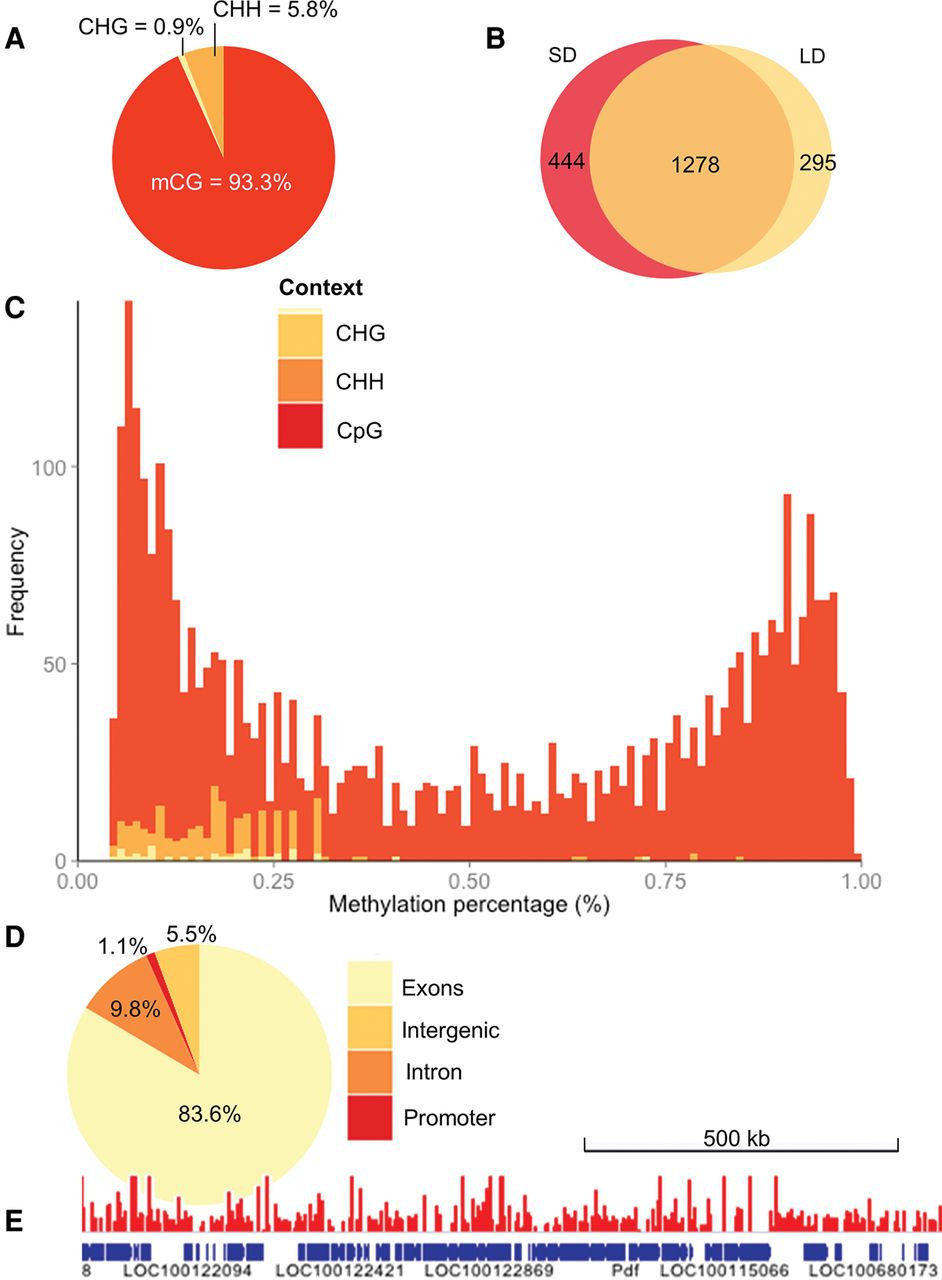
The Nasonia methylome. (A) Distribution of mCs identified in different sequence contexts (mCG, mCHG, and mCHH, where H = non-G). (B) Venn diagram showing that a substantial proportion of the mCGs are methylated under both long- and short-day conditions in contrast to other sequence contexts that show negligible overlap (see text), suggesting that non-CpG methylation represents largely experimental noise. (C) The methylation level of CpG sites (percentage of covering reads that are methylated) shows a bimodal distribution. This bimodality is not seen in CHG or CHH (shaded yellow and orange) methylation contexts. (D) Fraction of mCGs identified in exon, intron, promoters (2-kb upstream of genes), and intergenic regions. (E) A snapshot of the methylome (751-kb region) is depicted overlaid with the raw long-day methylation data (scaled to 0%–2% methylation).


