
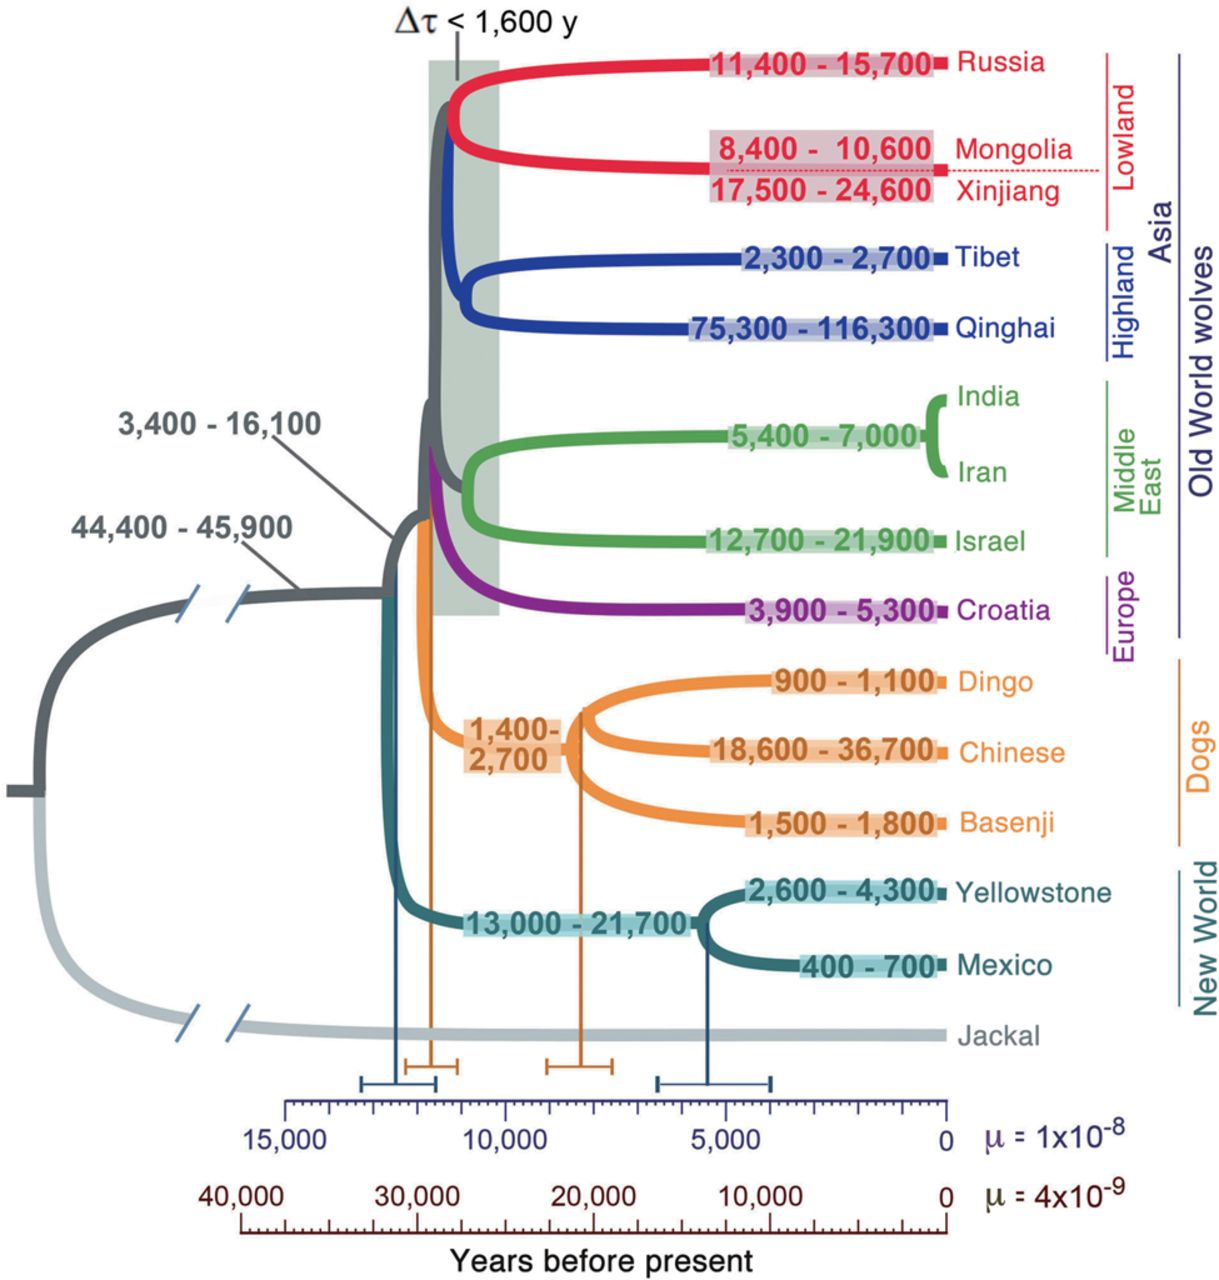
Demographic model inferred using G-PhoCS. Estimates of divergence times and effective population sizes (Ne) inferred by applying a Bayesian demography inference method (G-PhoCS) to sequence data from 13,647 putative neutral loci in a subset of 22 canid genomes (because of limitations in computational power). Estimates were obtained in four separate analyses (Methods; Supplemental Table 6). Ranges of Ne are shown and correspond to 95% Bayesian credible intervals. Estimates are calibrated by assuming a per-generation mutation rate of μ = 10−8. Mean estimates (vertical lines) and ranges corresponding to 95% Bayesian credible intervals are provided at select nodes. Scales are given in units of years by assuming an average generation time of 3 yr and two different mutation rates: μ = 10−8 (dark blue) and μ = 4 × 10⁻⁹ (brown). The model also considered gene flow between different population groups (see Table 1).


