
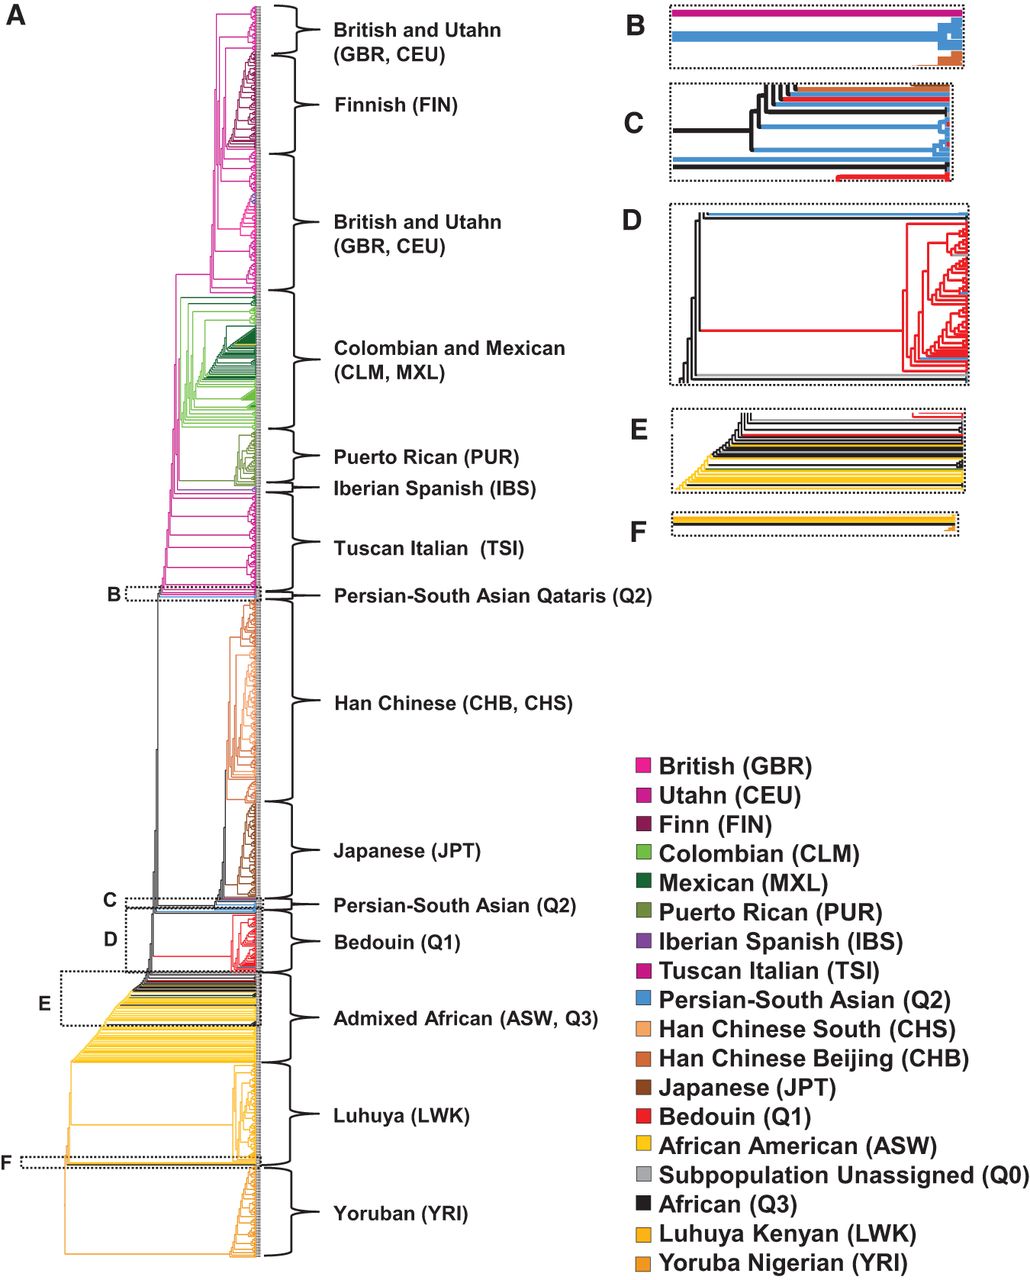
Neighbor-joining tree hierarchical clustering analysis of the combined Qatari genomes and the 1000 Genomes Project Phase 1 samples based on pairwise proportion of shared alleles calculated across the entire autosome. (A) The entire neighbor-joining tree with each of the branches leading to individuals in the 1000 Genomes samples color-coded by continent (Europeans in shades of purple: CEU, FIN, GBR, IBS, TSI; Asians in shades of brown: CHB, CHS, JPT; Africans in shades of orange: LWK, YRI, ASW; Americans in shades of green: CLM, MXL, PUR) and with the Q1 (Bedouin) in red, Q2 (Persian-South Asian) in azure, Q3 (African) in black, and Q0 (Subpopulation Unassigned) in gray. (B) Detail of the three (15%) Q2 (Persian-South Asian) that cluster with Europeans. (C) Detail of the 11 (55%) Q2 (Persian-South Asian) individuals, with three (5%) Q1 (Bedouin), one (5%) Q3 (African), and one (13%) Q0 (Subpopulation Unassigned) that cluster as an outgroup to Asians. (D) Detail of the 50 (89%) Q1 individuals, with three (15%) Q2 (Persian-South Asian), one (5%) Q3 (African), and two (25%) Q0 (Subpopulation Unassigned), that cluster outside the Africans and African Ancestry in Southwest US and that also cluster as an outgroup to all other non-African populations, indicating that they are the most distant ancestors of all non-Africans. (E) Detail showing the three (15%) Q1 (Bedouin), three (15%) Q2 (Persian-South Asian), 12 (60%) Q3 (African), and four (50%) Q0 (Subpopulation Unassigned) that do not form large clusters but are all located within the admixed cluster. (F) Detail of the one (5%) Q3 (African) that clusters between Yoruba (YRI) and Luhya (LWK).


