
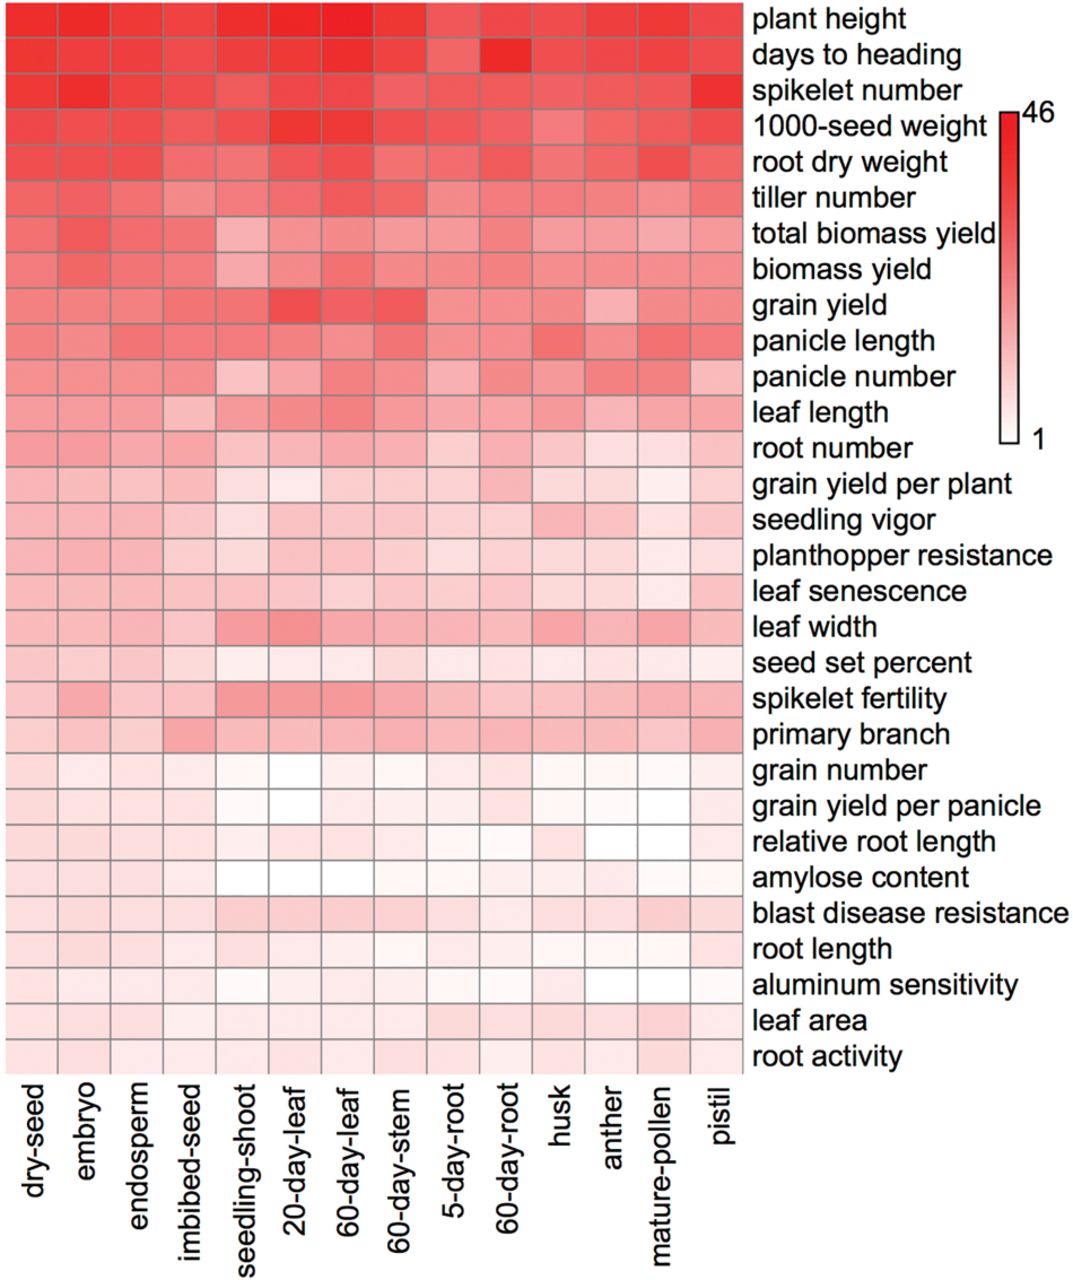
Figure 6.
Number of highly expressed APA genes are enriched in QTLs (top 30) across 14 tissues. Each color block represents PAC amount (scale bar on the right) of QTL in each tissue.
(Downloading may take up to 30 seconds. If the slide opens in your browser, select File -> Save As to save it.)
Click on image to view larger version.
Number of highly expressed APA genes are enriched in QTLs (top 30) across 14 tissues. Each color block represents PAC amount (scale bar on the right) of QTL in each tissue.
 CiteULike
 Delicious
 Digg
Digg Facebook
 Google+
 Reddit
 Twitter
