
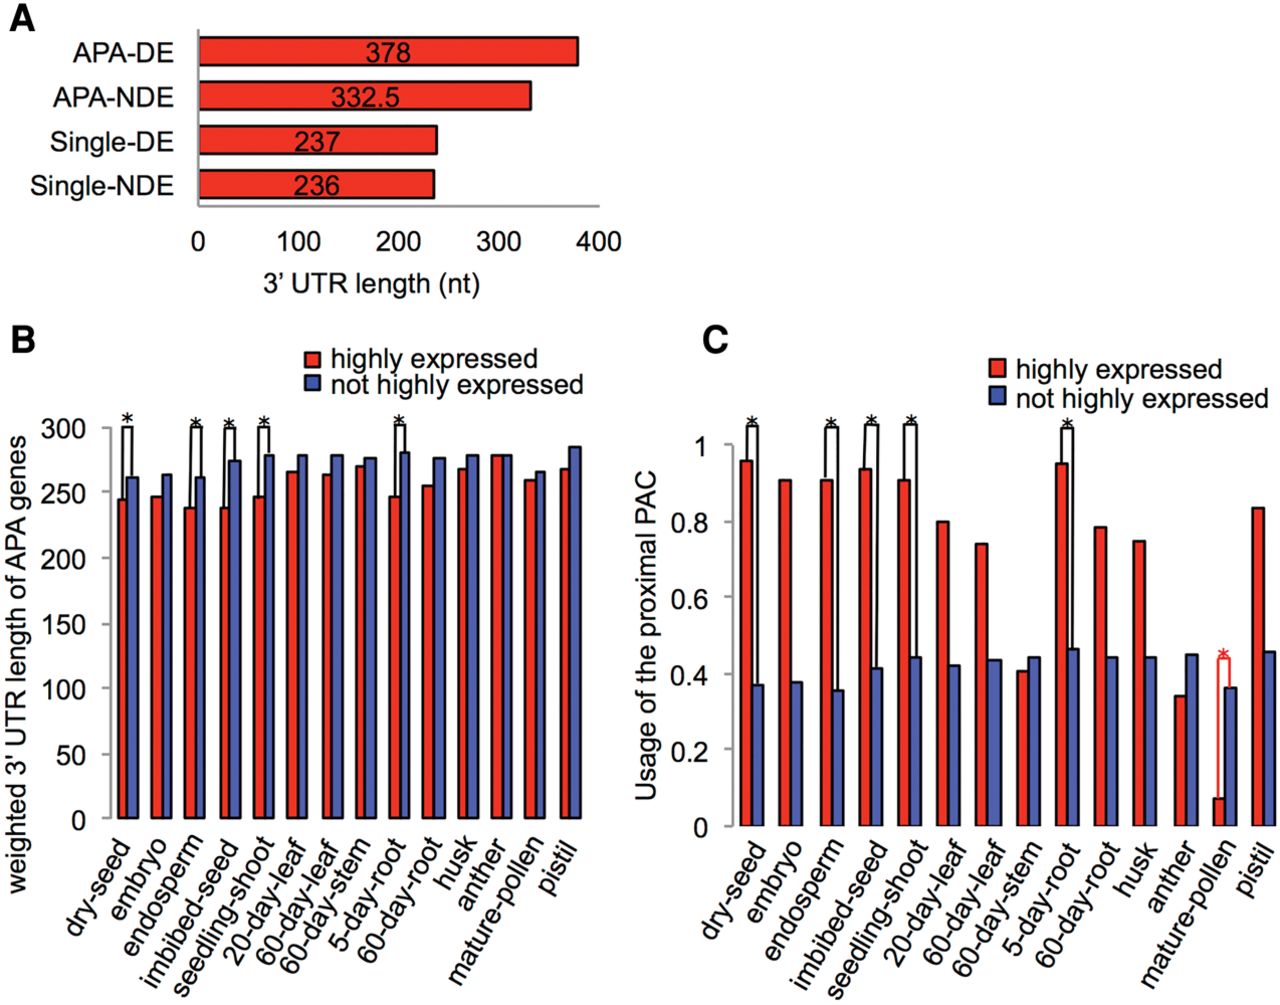
3′ UTR length analyses. (A) Median 3′ UTR length of distal PACs in different groups of genes. (APA-DE) Genes with at least one differentially expressed (DE) PAC; (APA-NDE) genes with multiple PACs but none is DE PAC; (single-DE) DE genes with single PAC; (single-NDE) genes with single PAC and not DE. The median length of proximal PACs for APA-NDE is 189 nt, and for APA-DE is 204 nt. (B) The weighted 3′ UTR median length of the highly and not highly expressed APA genes. (C) Usage of the proximal PAC in highly expressed genes of APA across tissues. The red line in mature pollen marks a reverse trend where highly expressed genes use less proximal PACs. Asterisk presents statistically significant differences (P-value <0.05).


