
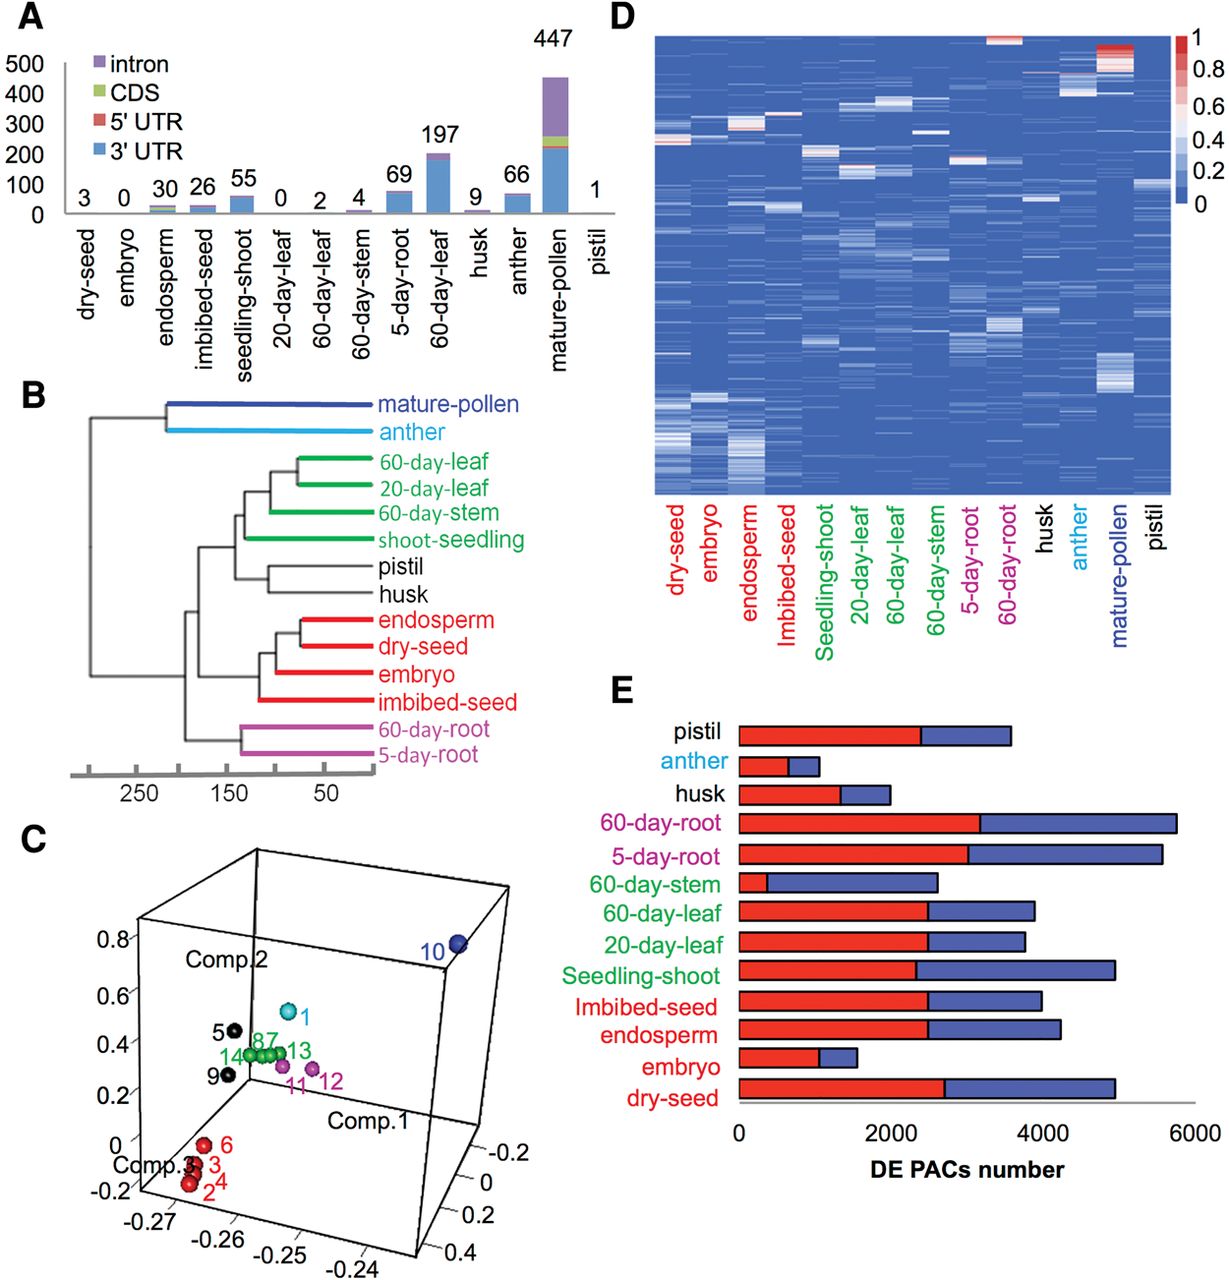
Expression patterns of PACs across 14 tissues. (A) Number of tissue-specific PACs in different samples. (B) The Euclidean distances between the samples as calculated from the regularized log transformation. (C) Principal component analysis of PAC expression pattern across 14 tissues: 1, anther; 2, dry seed; 3, embryo; 4, endosperm; 5, husk; 6, imbibed seed; 7, leaf_20days; 8, leaf_60days; 9, pistil; 10, pollen; 11, root_5days; 12, root_60days; 13, seedling shoot; 14, stem_60days. (D) PAT ratio of differentially expressed PACs across 14 tissues. DE PACs were identified by DEXSeq. For each DE PAC, the PAT ratio is calculated as the ratio of number of PATs in a respective tissue to the total number of PATs in all tissues. (E) The number of differentially expressed PACs between pollen and other tissues. The red bar represents up-regulated PACs, and the blue bar represents down-regulated PACs.


