
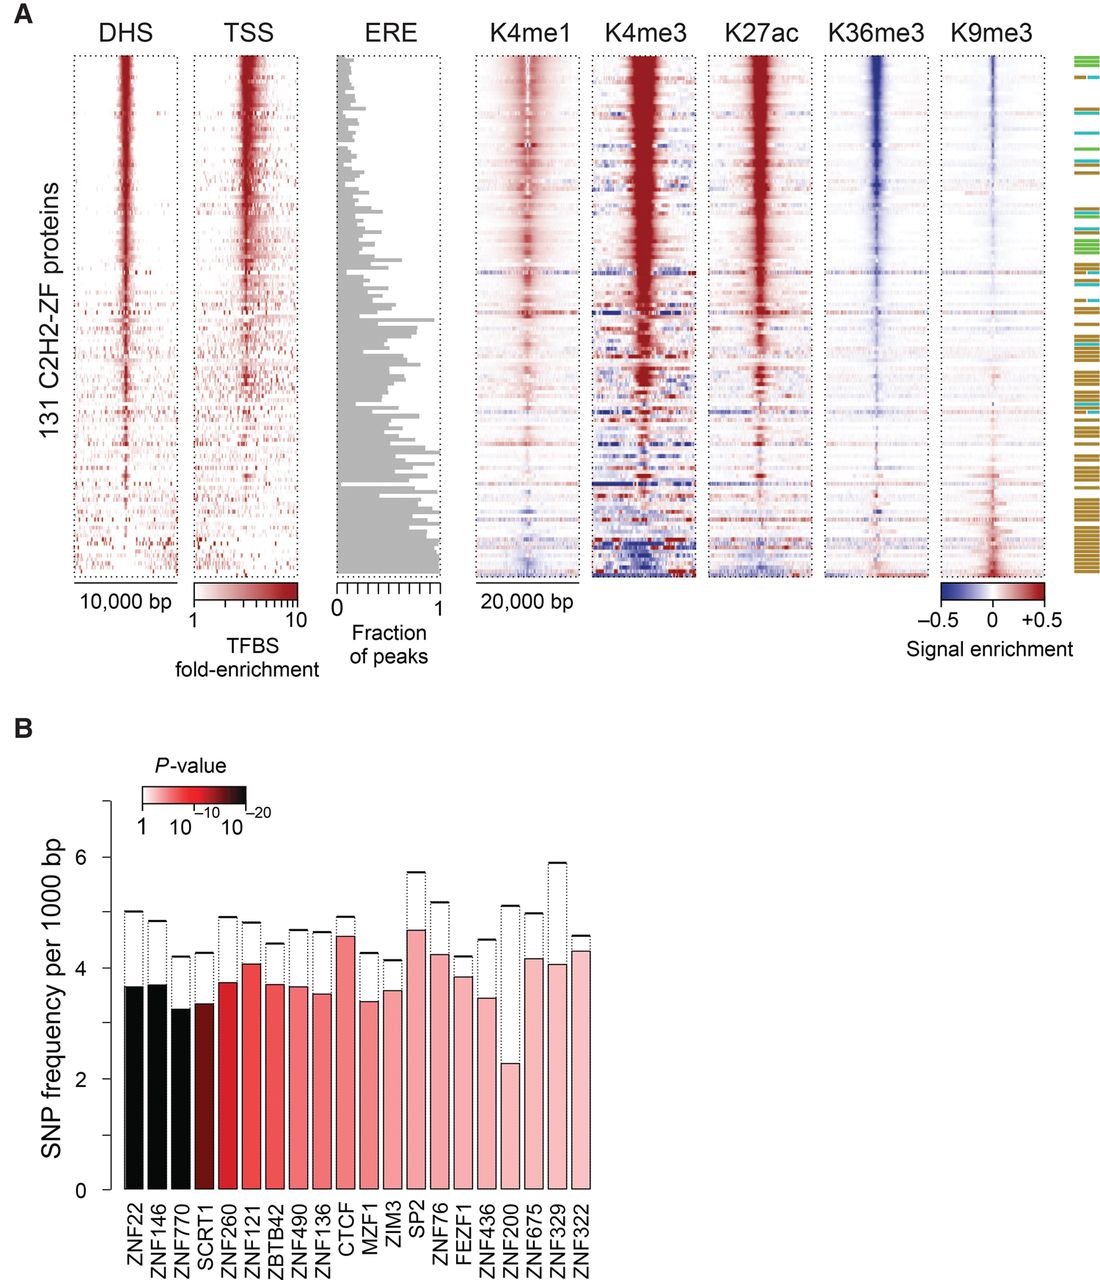
Genomic distribution of C2H2-ZF binding sites. (A) Enrichment of binding sites around different genomic features as well as histone marks. For DHS and TSS, the color map represents fold-enrichment of binding sites around these genomic features relative to distribution of binding sites around random genomic points. For histone marks, the color map shows base-10 logarithm of fold-change of histone mark signal around binding sites, relative to the genomic average of the signal. For EREs, the fraction of peaks that overlap any ERE instance on the genome is shown. (B) Distribution of common SNPs inside C2H2-ZF binding sites, compared to immediate ±20 bp flanking regions. The filled bars represent the frequency of common SNPs within motif hits in the peak regions, whereas dashed bars correspond to the SNP frequency in the ±20 bp region surrounding the motif hits. P-values (based on Binomial test) are shown using the color gradient. Only the proteins with significant SNP depletion at binding sites (FDR<0.025) are shown.


