
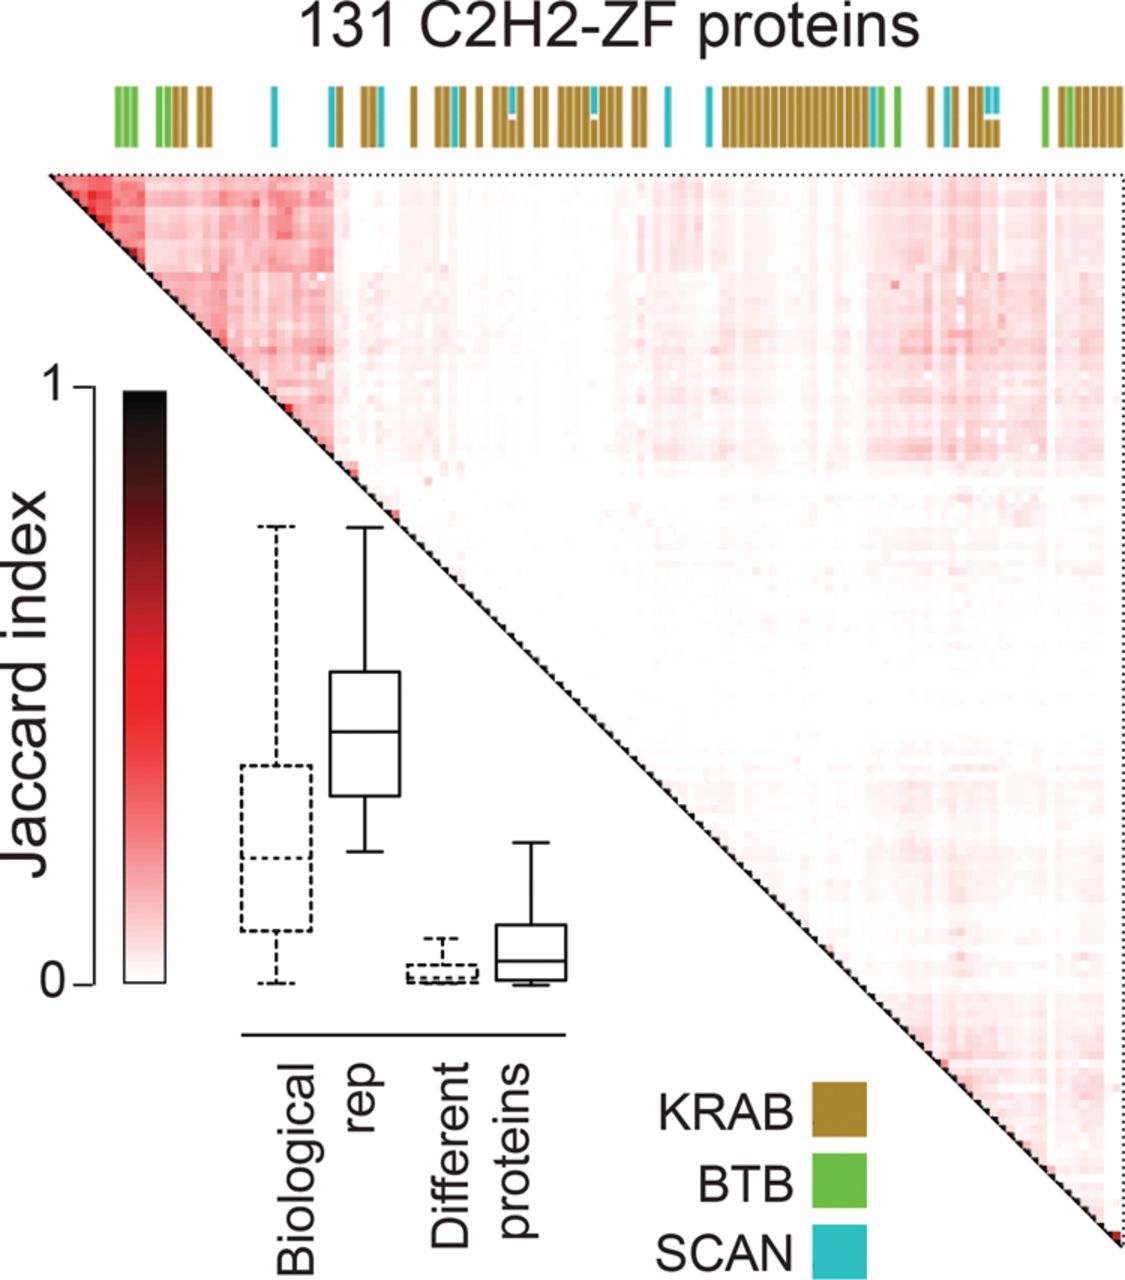
ChIP-seq analysis of 131 human C2H2-ZF proteins, shown as Jaccard similarity among different proteins, as well as between replicates. The heat map shows Jaccard similarity for binding sites of pairs of proteins, with the maximum Jaccard value used in cases where any of the two proteins had replicates. The boxplot compares the distribution of Jaccard similarities of replicates and pairs of different proteins. Bars represent the first and third quartiles and the lower and upper whiskers represent the lowest and highest datum still within 1.5× IQR of the lower and upper quartiles, respectively, where IQR is the interquartile range. Dashed boxes represent the whole data set, the solid-line boxes the filtered data set (Med500 score >600). The colored bars on the top of the heat map represent different effector domains, with the color legend shown at the bottom. See also Supplemental Figure S1, Supplemental Tables S1 and S4.


