
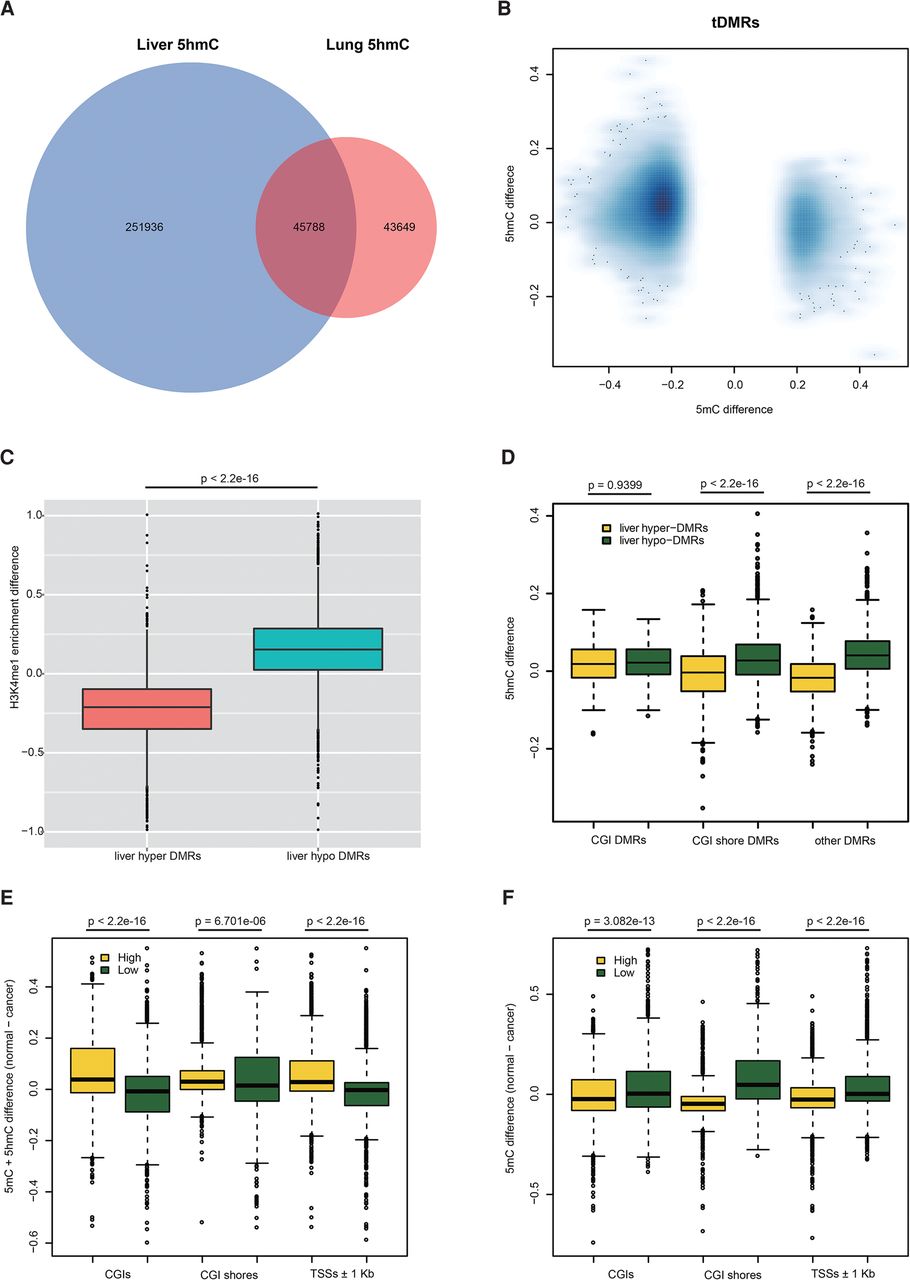
5mC change of t-DMRs and c-DMRs anticorrelated with 5hmC and H3K4me1 changes. (A) Venn diagram of identified liver and lung 5hmC regions. (B) Negative correlation between 5mC difference and 5hmC difference on t-DMRs. (C) Negative correlation between 5mC difference and H4K4me1 enrichment difference on t-DMRs. (D) 5hmC difference on different t-DMR categories. 5hmC difference on non-CGI t-DMRs showed a larger difference than that of CGI t-DMRs. (E) Cytosine modification difference (5mC + 5hmC) between normal and tumor at promoters with high and low 5hmC level in liver. (F) Only DNA methylation difference (5mC) between normal and tumor at promoters with high and low 5hmC level in liver. Promoters were ranked according to the 5hmC level, and the highest and lowest 10th percentiles of the promoter were used for our analysis.


