
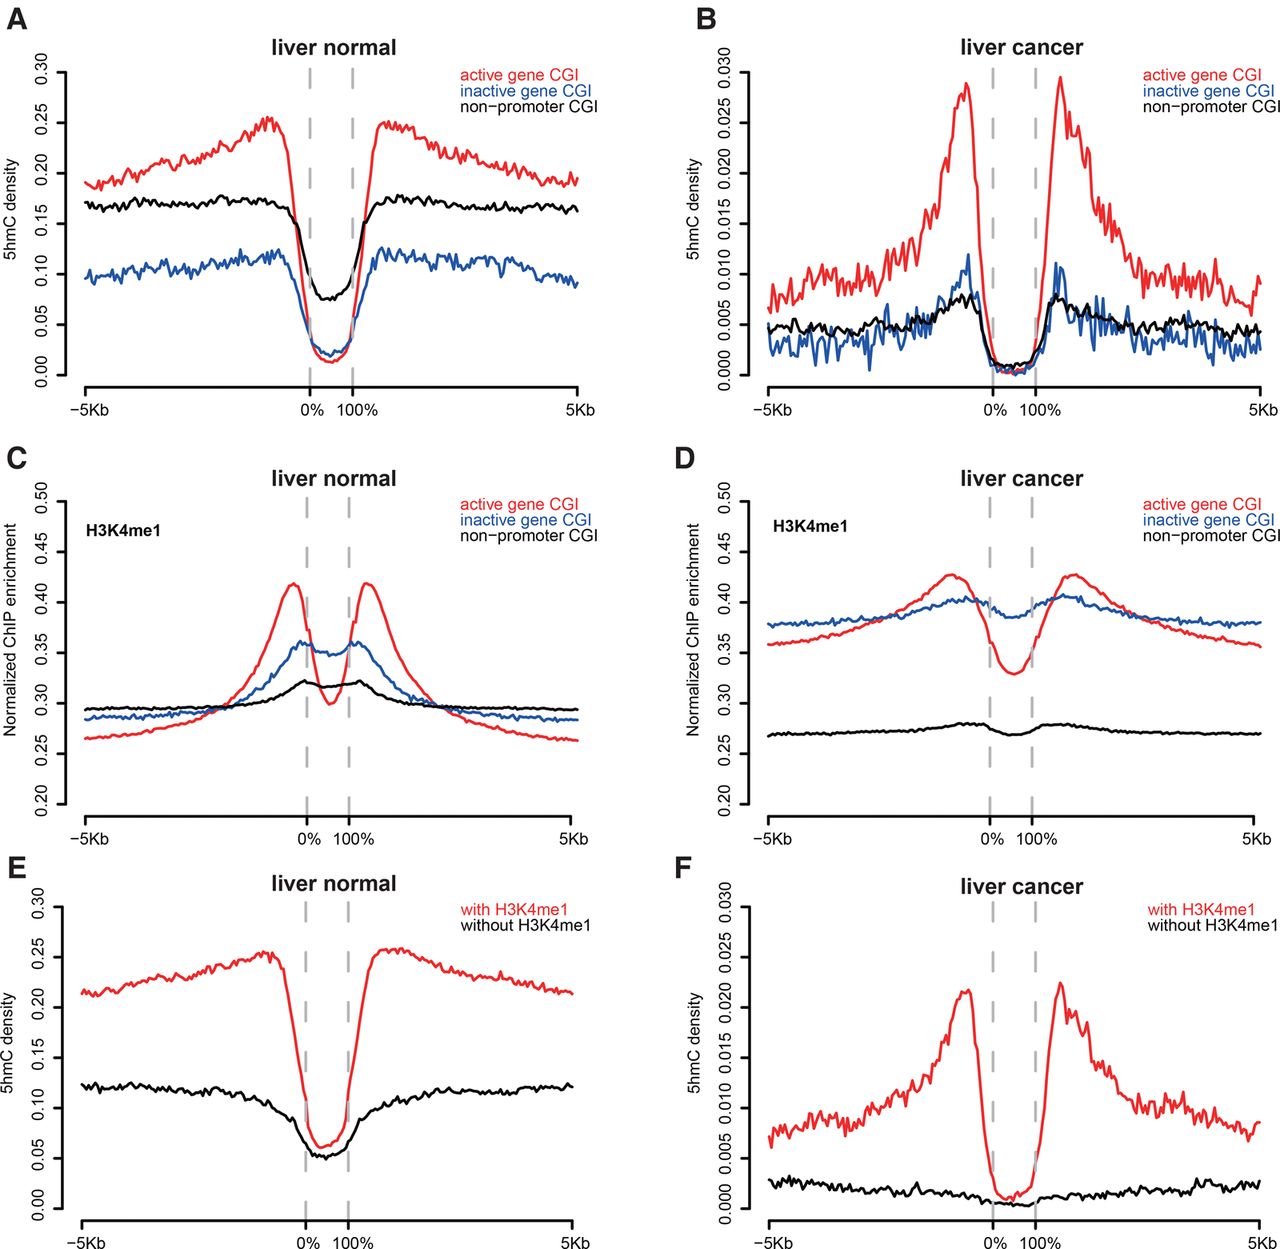
Figure 3.
5hmC showed a bimodal distribution around CGIs and associated with H3K4me1. (A,B) 5hmC distribution around different CGI categories in liver normal (A) and liver tumor (B). (C,D) H3K4me1 enrichment around different CGI categories in liver normal (C) and liver tumor (D). (E,F) H3K4me1 associated with 5hmC enrichment in CGI shores in liver normal (E) and liver tumor (F).


