
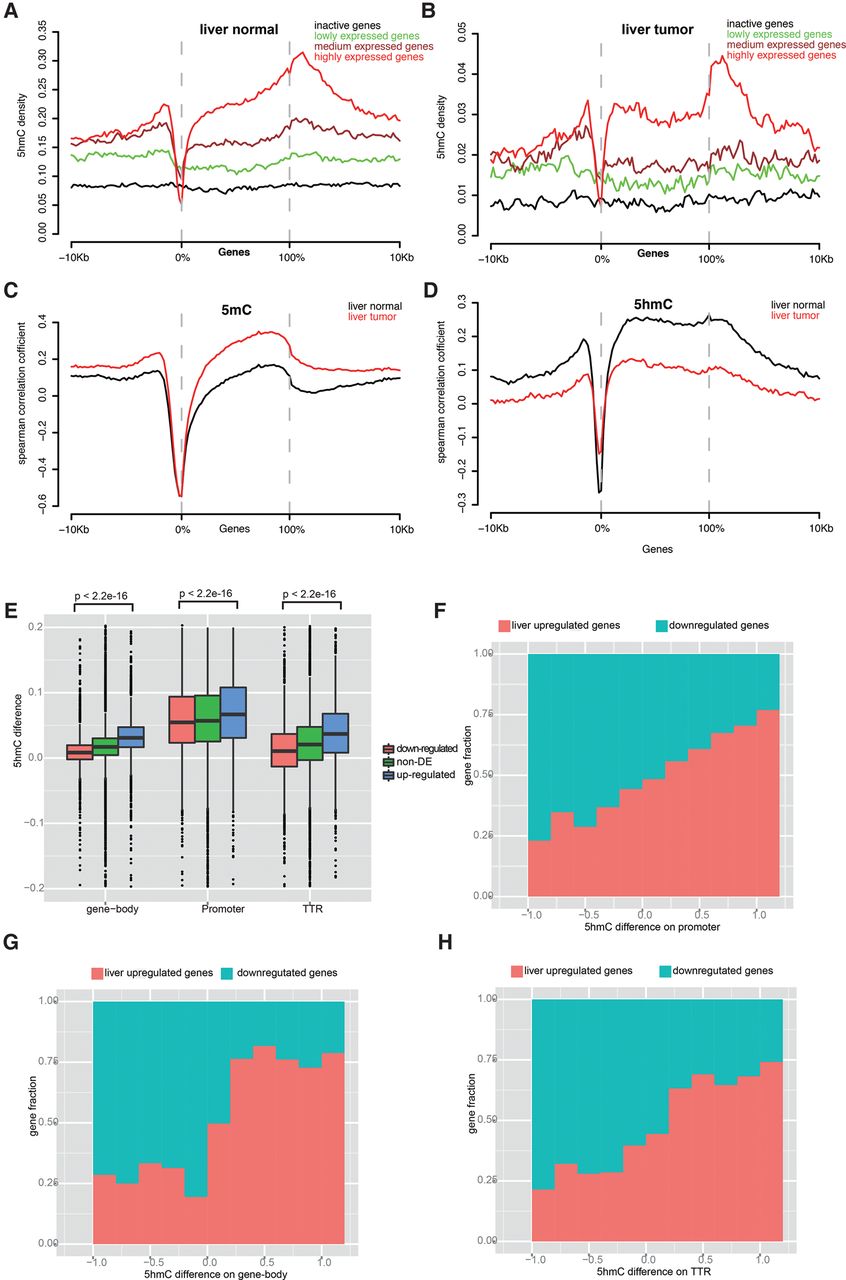
5hmC distribution around genic regions and 5hmC positively correlated with gene expression. (A,B) 5hmC distribution across active and inactive genes and their 10-kb flanking regions in liver normal (A) and liver tumor (B). All genes were classified into active and inactive genes. Active genes were further divided into three groups with equal numbers of genes by quintile based on gene expression (FPKM value): lowly, medium, and highly expressed genes. (C,D) Spearman correlation coefficient around genic region between 5mC (C), 5hmC (D), and gene expression. (E) 5hmC difference between normal liver and lung at three genomic features in liver: up-regulated, down-regulated, and non-DE genes. (F–H) Comparison of 5hmC difference between normal liver and lung on promoter (F), gene body (G), and TTR (H) and gene expression changes between tissues.


