
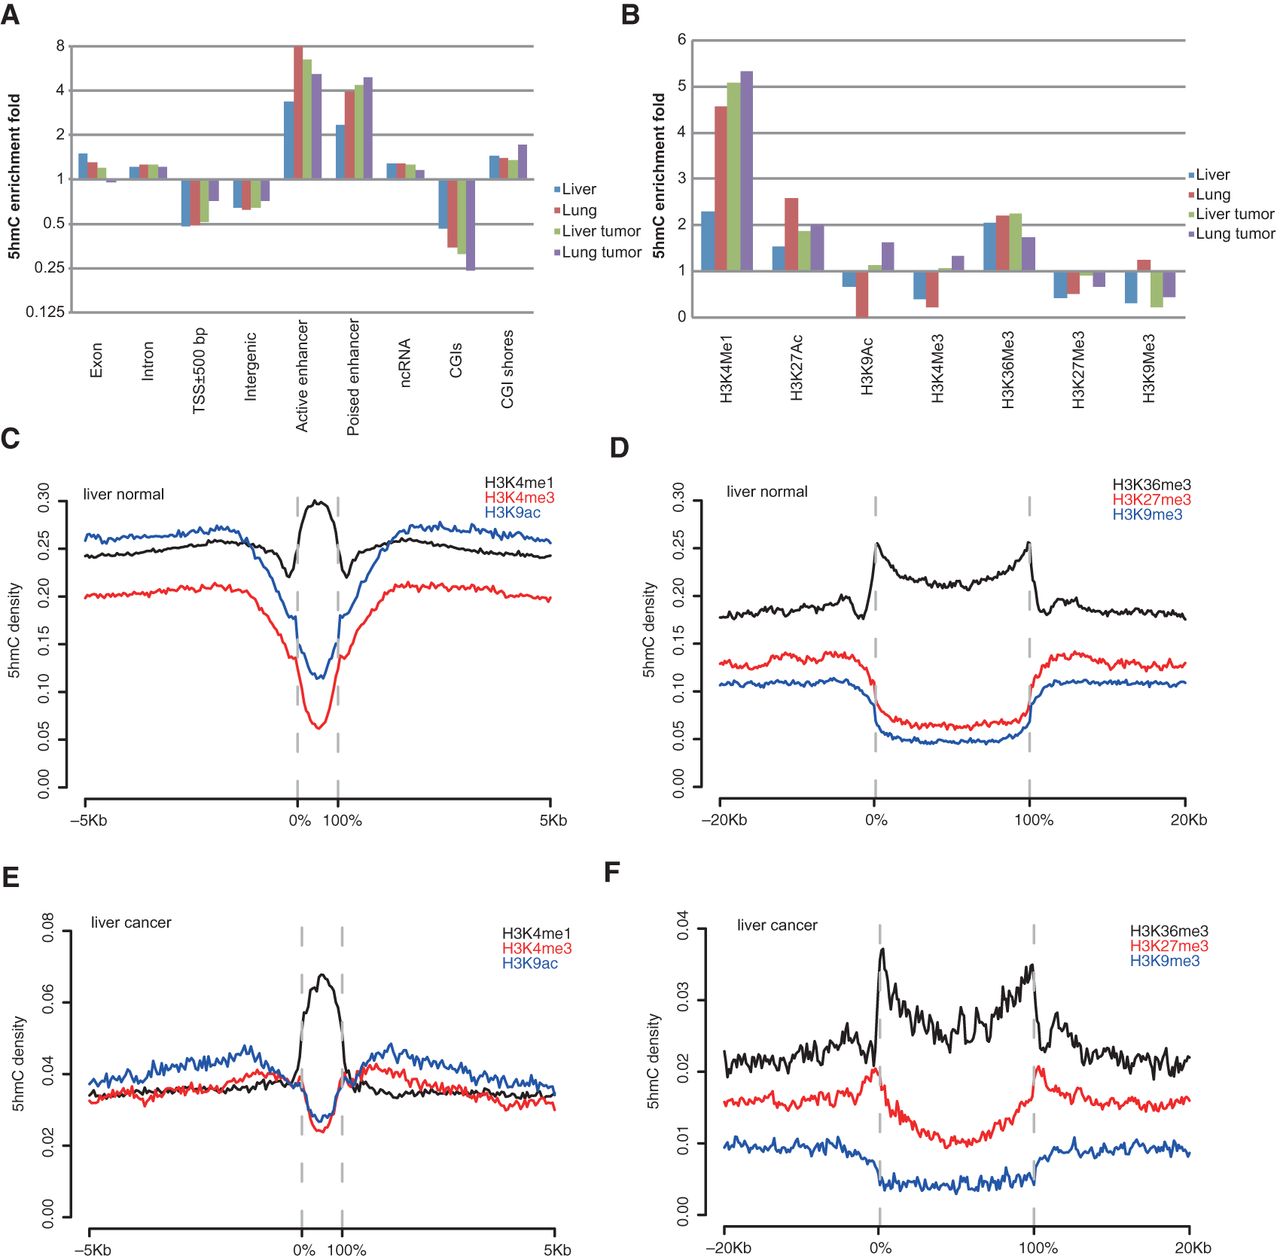
The hydroxymethylation landscapes of human normal and tumor tissues. (A,B) 5hmC fold enrichment in different genomic features (A) and histone modifications (B). 5hmC enrichment fold in each genomic feature was calculated as the ratio of 5hmC density of that feature to the genome-wide average 5hmC density. H3K9ac ChIP-seq data for lung normal is not available. (C–F) 5hmC density distribution across narrow and broad histone modifications and their flanking regions in liver normal (C,D) and liver tumor samples (E,F). Zero percent and 100% on the x-axis indicate the start and end of all called histone peaks/domains. For each liver/lung normal/cancer group, 5hmC density was averaged among biological replicates.


