
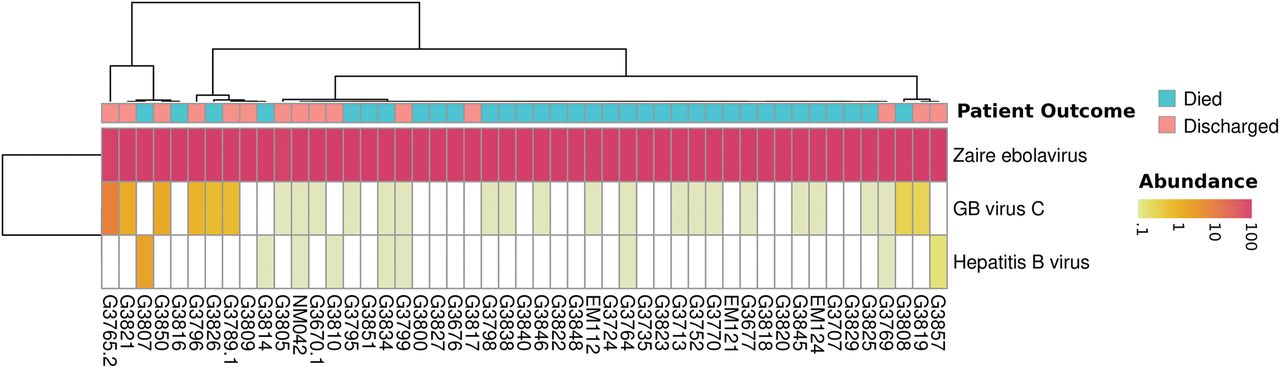
Figure 4.
Heat map of the most abundant species in Ebola samples. The color scale encodes species abundance (the number of unique reads normalized by genome size), ranging from yellow (<0.1% of the normalized read count) to red (100%), with white representing an abundance of zero. All species that have a normalized read count over 1% in any of the samples are shown. Zaire ebolavirus dominates the samples; however, there is also a signal for other viruses in some of the patients—namely GB virus C and Hepatitis B virus.


