
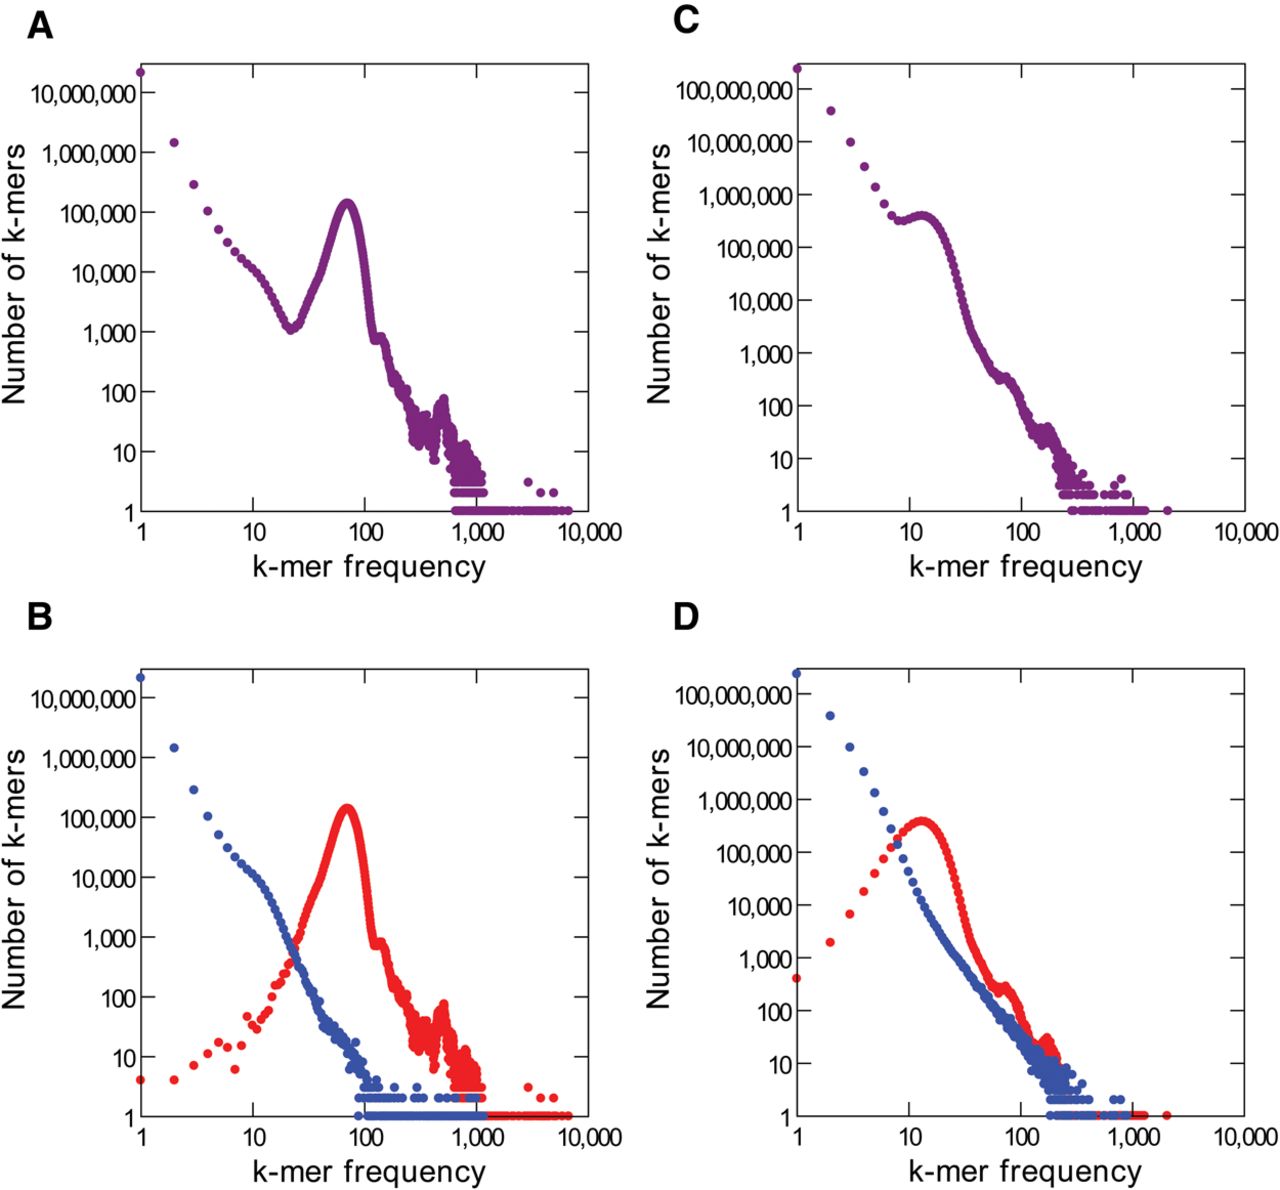
Figure 1.
k-mer frequency distributions for Illumina and PacBio E. coli reads. (A) Illumina, all k-mers (k = 16 in all panels). (B) Illumina, with correct k-mers shown in red and error k-mers in blue. Note that most error k-mers have very low frequency. The peak at k-mer frequency about 70 corresponds to genomic single copy k-mers. (C,D) PacBio reads. Note the huge number of error k-mers. The reference list of valid k-mers came from the finished genome (see Methods).


