
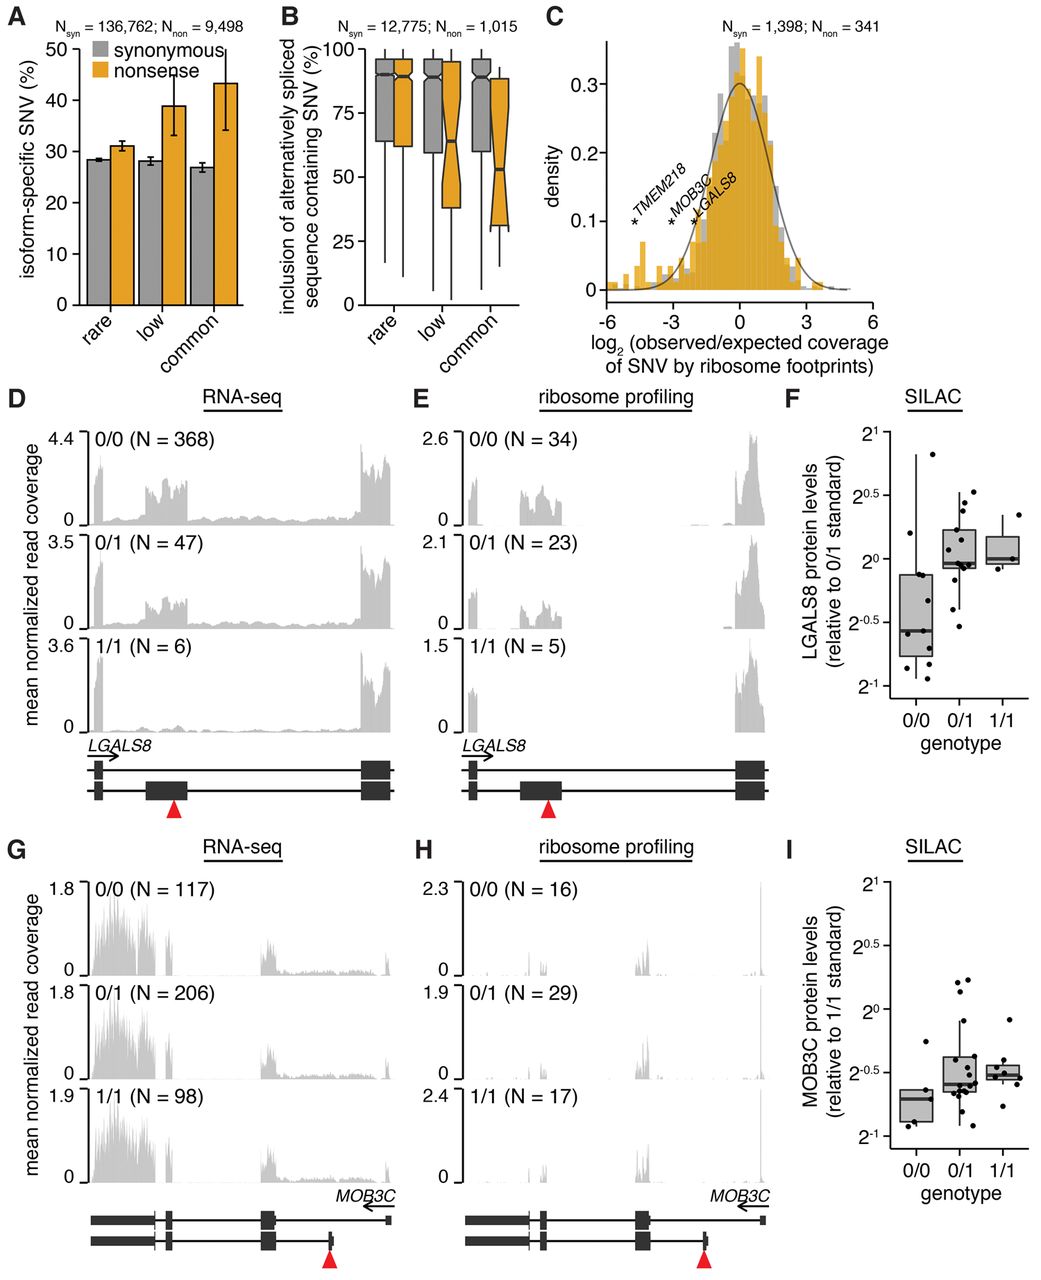
Alternative splicing, promoter usage, and polyadenylation remove nonsense genetic variants from mature mRNA. (A) Percentages of variants that are isoform specific. Isoform-specific variants are defined as those that do not induce the indicated coding change within at least one RefSeq CDS of the parent gene or that lie within known alternatively spliced mRNA sequence. Plot restricted to variants that lie within genes containing nonsense variants. (N) Number of analyzed variants. Error bars, 95% confidence intervals as estimated by the binomial proportion test. (B) Median inclusion of variants lying within known alternatively spliced mRNA sequence across 16 human tissues. An inclusion level of 75% indicates that 75% of mRNAs transcribed from the parent gene contain the variant, while 25% do not. Inclusion was computed using the Body Map 2.0 data. (Notches) Approximate 95% confidence interval for the median. Plot restricted to variants that lie within genes containing nonsense variants. (C) Histogram of observed versus expected coverage of variants by ribosome footprints. Observed coverage was computed as the number of footprints overlapping each variant; expected coverage was computed as the total number of footprints overlapping each variant's host CDS, normalized such that the median of the ratio observed:expected over all variants was equal to one. All footprint coverage calculations were restricted to 0/0 samples to avoid potentially confounding effects of nonsense variants, and the plotted values indicate medians over those samples. (Black line) Best-fit normal distribution estimated from synonymous variants. Plot restricted to variants that lie within genes containing nonsense variants and that are present in samples for which ribosome profiling data were available. RNA-seq (D) and ribosome profiling (E) read coverage of a nonsense variant lying within a cassette exon of LGALS8, stratified by sample genotype. Coverage was normalized per sample to control for sequencing depth and then averaged over all samples with the indicated genotypes. Units are reads per million. (Red triangle) Location of nonsense variant. (F) LGALS8 protein levels relative to a sample standard with genotype 0/1. RNA-seq (G) and ribosome profiling (H) read coverage of a nonsense variant lying within an alternate 5′ exon of MOB3C. (I) MOB3C protein levels relative to a sample standard with genotype 0/1.


