
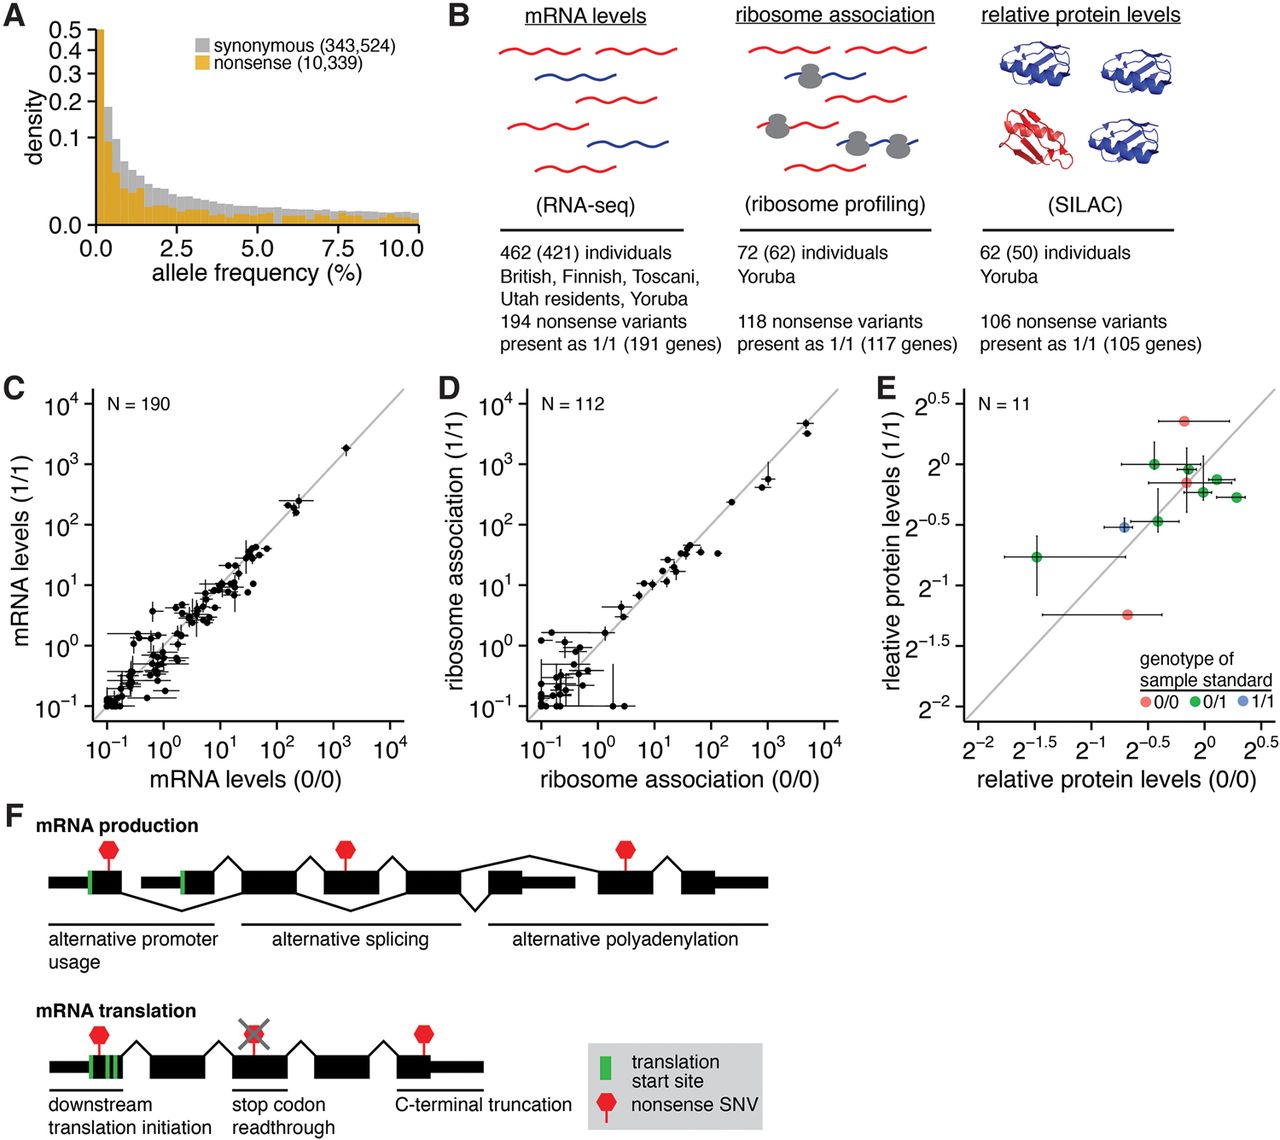
Putatively disabled genes exhibit normal levels of the encoded proteins. (A) Histogram of alternate allele frequencies for synonymous and nonsense variants identified by the 1000 Genomes Project (1000 Genomes Project Consortium 2012). (B) Genome-wide measurements of mRNA abundance (Lappalainen et al. 2013), mRNA:ribosome association (Battle et al. 2015), and protein abundance (Battle et al. 2015) in lymphoblastoid cell lines (LCLs) that we analyzed here. These data were available for 462, 72, and 62 individuals, respectively; however, we restricted our analyses to the 421, 62, and 50 individuals that were genotyped by sequencing. The represented populations are British in England and Scotland, Finnish in Finland, Toscani in Italy, Utah residents with Northern and Western European ancestry, and Yoruba in Ibadan, Nigeria. (SILAC) Stable isotope labeling by amino acids in cell culture (Ong et al. 2002). (C) Median RNA levels of CDSs containing nonsense variants, averaged across samples that are homozygous for the reference (0/0) or alternate (1/1) alleles. Error bars, first and fourth quartiles of expression across all 0/0 or 1/1 samples. Units are fragments per kilobase per million mapped reads (FPKM) of the CDS containing each variant. (N) Number of analyzed variants. Analysis based on the 194 nonsense variants stated in B but restricted to variants within Ensembl coding genes that were present as both 0/0 and 1/1 in samples with RNA-seq data. (D) As in C but illustrates mRNA:ribosome association as measured by ribosome profiling. Units are FPKM of the CDS containing each variant. Analysis based on the 118 nonsense variants stated in B but restricted to variants within Ensembl coding genes that were present as both 0/0 and 1/1 in samples with ribosome profiling data. (E) As in C but illustrates relative levels of proteins encoded by CDSs containing nonsense variants as measured by SILAC mass spectrometry. Units are protein levels relative to the sample standard (e.g., 20 indicates no change in protein levels relative to the standard), whose genotype for each variant is indicated by the point color. Protein levels were taken directly from Battle et al. (2015), who estimated protein levels as the median sample:standard ratio across all peptides arising from a single parent gene in each sample. Analysis based on the 106 nonsense variants stated in B but restricted to variants within Ensembl coding genes that were present as both 0/0 and 1/1 in samples with SILAC data. Fewer variants can be analyzed here than in C,D due to the low coverage of mass spectrometry data relative to RNA-seq or ribosome profiling. (F) Possible mechanisms to enable protein production from genes containing nonsense variants. Nonsense variants may be isoform specific, may result in N- or C-terminal truncation of the encoded protein, or may be subject to readthrough during translation.


