
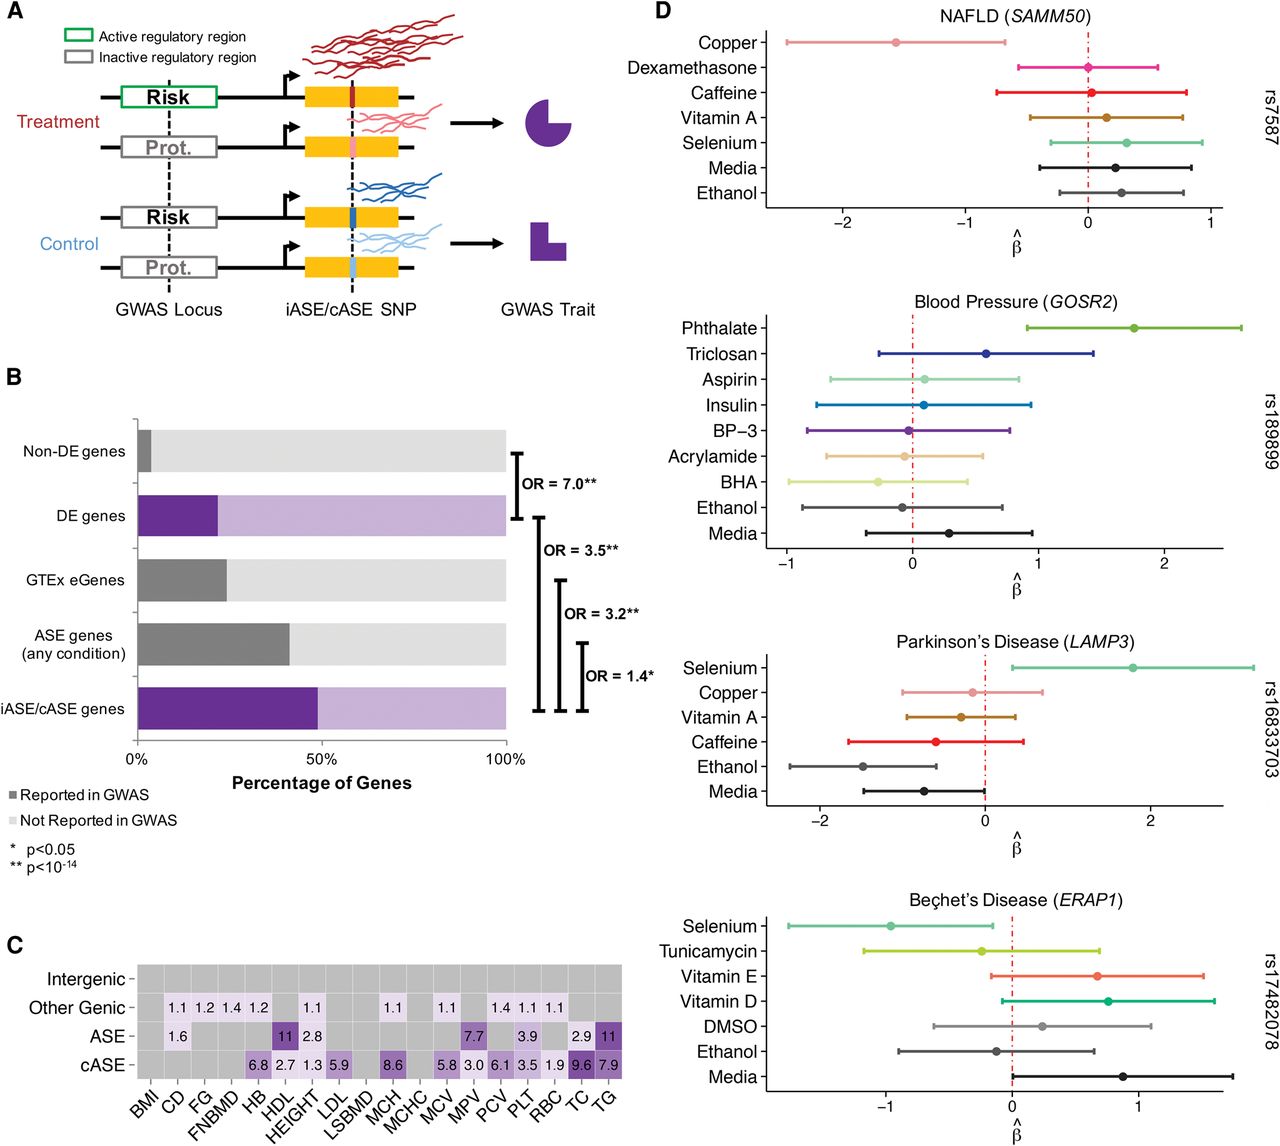
Integration with GWAS. (A) Hypothetical model detailing the use of GxE interactions to characterize putative molecular mechanisms for risk or protective
environmental factors for complex traits. In the treatment environment, a regulatory region is either active or inactive depending
on the haplotype, therefore resulting in different levels of gene expression. In the control environment, the regulatory region
is inactive regardless of haplotype. Risk and protective haplotypes are identified in GWAS. (B) Enrichment analysis of GWAS genes. Reported genes from the GWAS catalog (version 1.0.1) were compared to different gene
sets analyzed in this study: (1) genes that were not differentially expressed in any condition, (2) genes that were differentially
expressed in any condition, (3) genes previously associated with an eQTL in GTEx (eGenes) (The GTEx Consortium 2015), (4) genes containing ASE in any condition, and (5) genes containing either iASE or cASE. The percentage of genes in these
data sets that were found in the GWAS catalog is indicated by a darker shade. Genes that can be perturbed by our environments
are highlighted in purple and indicate a GxE mechanism for the GWAS association. Odds ratios and enrichment P-values were calculated using a Fisher's exact test and are shown on the right for each pair of gene categories contrasted. (C) Genome-wide efficient mixed model association (GEMMA) per SNP heritability estimates relative to the genomic average for
cASE (SNPs in genic regions with cASE or iASE), ASE (SNPs in genic regions with ASE), other genic (SNPs in genic regions),
and intergenic (SNPs <100 kb from any gene). Only significant enrichment values are reported, with a darker tone of purple
indicating a higher enrichment odds ratio relative to the genome average. (D) Forest plots of four cASE SNPs in genes associated with a GWAS trait. For each SNP, shown is the ASE  for each treatment in which the SNP was tested. The 95% CI bars are colored for each treatment as in Figure 2.


