
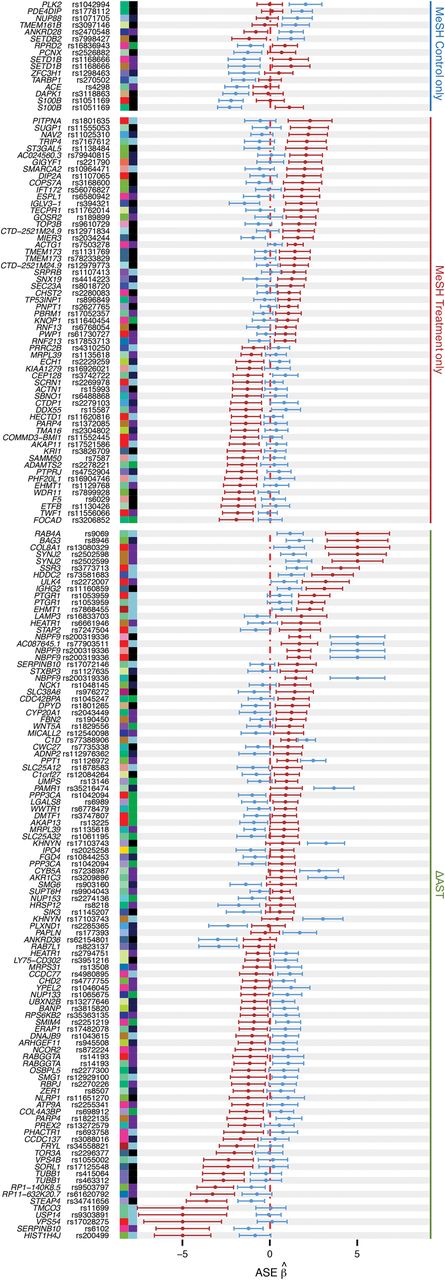
Figure 4.
Forest plot of all cASE SNPs. Each row shows the ASE  for paired treatment (red) and control (blue) conditions. Defined as in Figure 2, colored squares indicate the treatment (left) and cell type (right) in which cASE was identified, along with the gene name and SNP rsID.


