
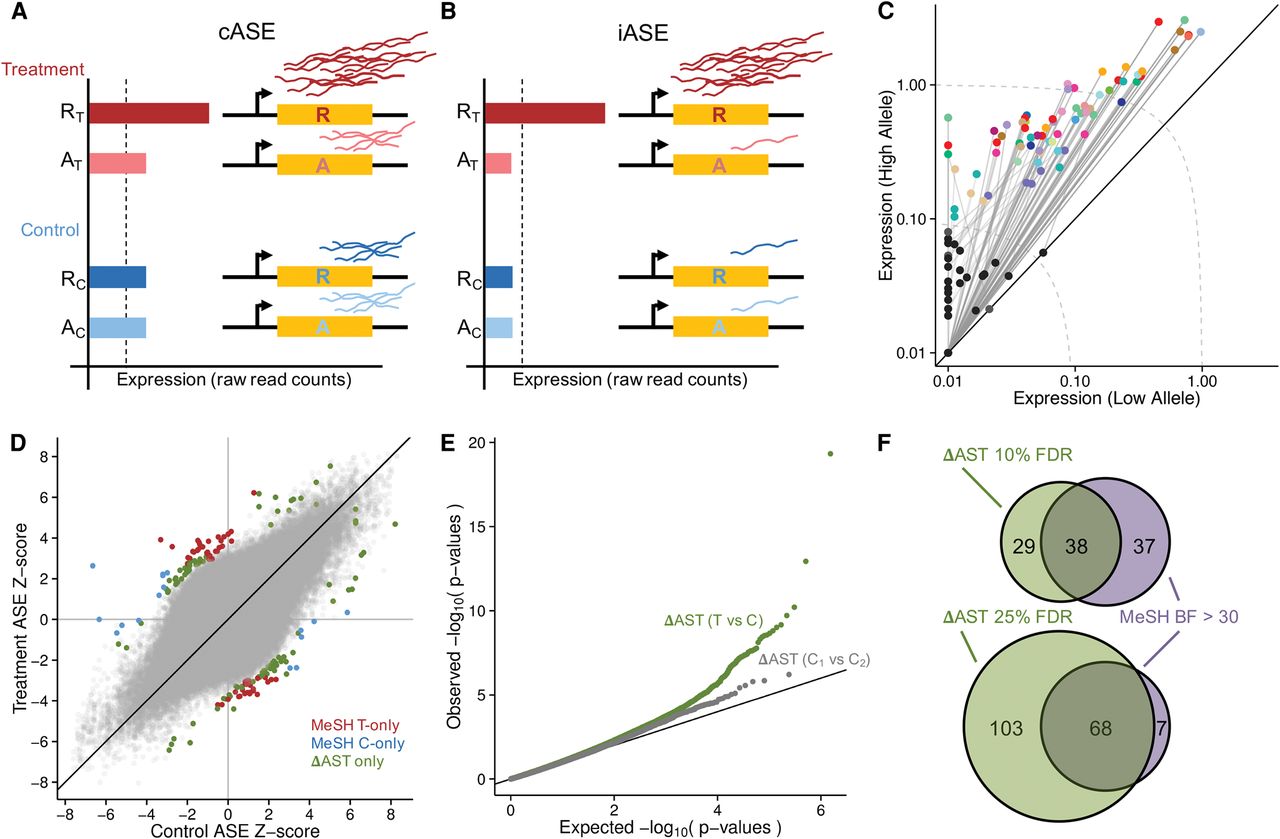
Gene–environment interactions. (A,B) Two types of gene–environment interactions: conditional ASE (A) and induced ASE (B). Treatment conditions are in red and control conditions in blue, with the shade (dark/light) representing the allele (reference/alternate). In this example of cASE, there is an imbalance of expression between the two alleles in the treatment condition, while the control shows balanced expression. iASE is defined by an imbalance of expression between the two alleles in the treatment condition and by expression below detectable levels (dotted line) in the control condition. (C) Plot of all iASE SNPs detected. Each iASE SNP is represented as two points (representing treatment and control expression) connected by a line (representing the fold-change between conditions). SNPs are plotted based on the expression (TPM [tags per million]) of each allele, with the higher expressed allele in the treatment on the y-axis and the lower allele on the x-axis. Points are colored by treatment (controls are black and gray), and the dotted lines represent constant expression levels 0.1, 1, and 10. For ease of display, expression of SNPs <0.01 have been set to 0.01. (D) Scatter plot of the Z-scores in the paired treatment and control samples for all SNPs tested for cASE. Colored points indicate those displaying cASE: Red is SNPs identified by meta-analysis of subgroup heterogeneity (MeSH) as having cASE in the treatment, blue is SNPs identified by MeSH as having cASE in the control, and green is SNPs identified by ΔAST (differential allele-specific test) that were not identified by MeSH. (E) QQ-plot of P-values for cASE identified with the ΔAST method for treatment versus control (green line) and Control 1 versus Control 2 (gray line). (F) Venn diagrams showing the number of cASE SNPs identified by two methods: MeSH and ΔAST at different empirically estimated FDR thresholds.


