
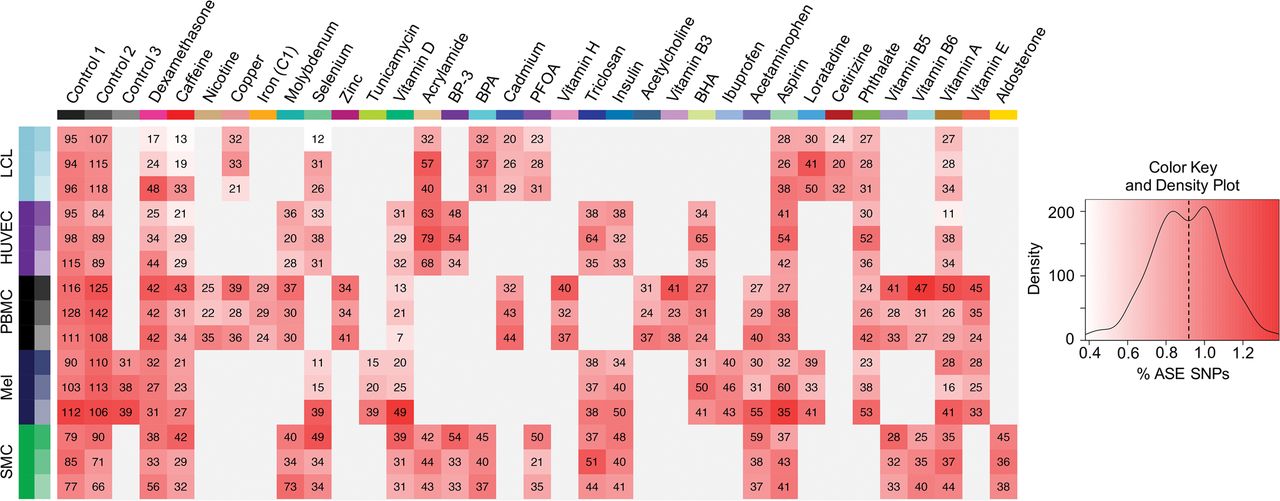
Figure 2.
Heatmap of allele-specific expression (ASE). For each individual (row) and treatment (column) we list the number of SNPs displaying ASE (as determined in QuASAR [quantitative allele-specific analysis of reads] at 10% FDR). The shade of red represents the fraction of ASE SNPs to the number of heterozygous SNPs tested (% ASE SNPs) in a given sample and condition. The dotted line on the density plot indicates the average % ASE SNPs across all individual samples and conditions.


