
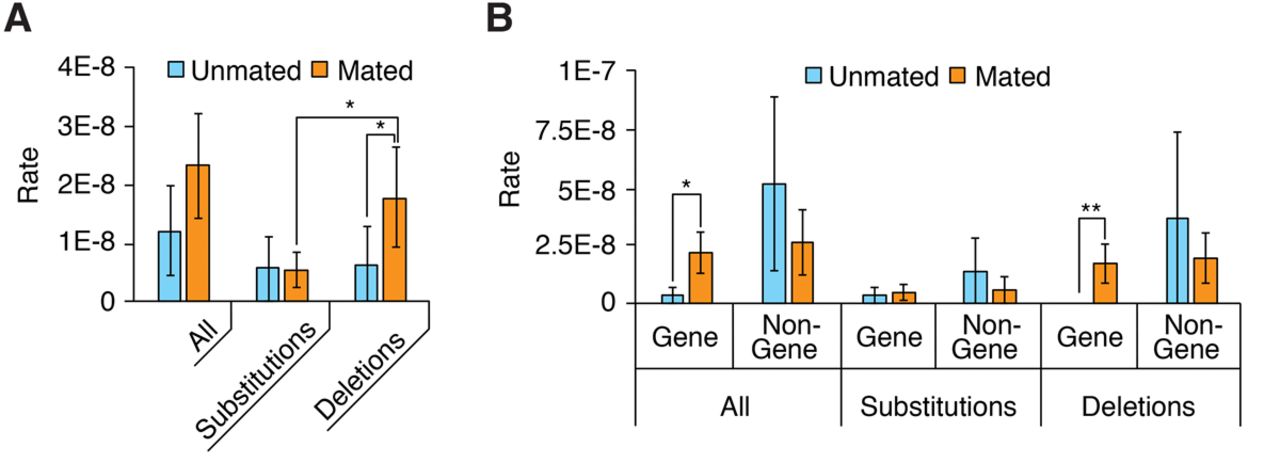
Figure 4.
Characterization of mutations. (A,B) Distribution of mutations broken down by mutation type (A) or genome region (B). Error bars, SEM; asterisks denote the significance of pairwise differences computed using bootstrapped confidence intervals ([*] P < 0.05; [**] P < 0.01), with P-values corrected using the Bonferroni procedure.


