
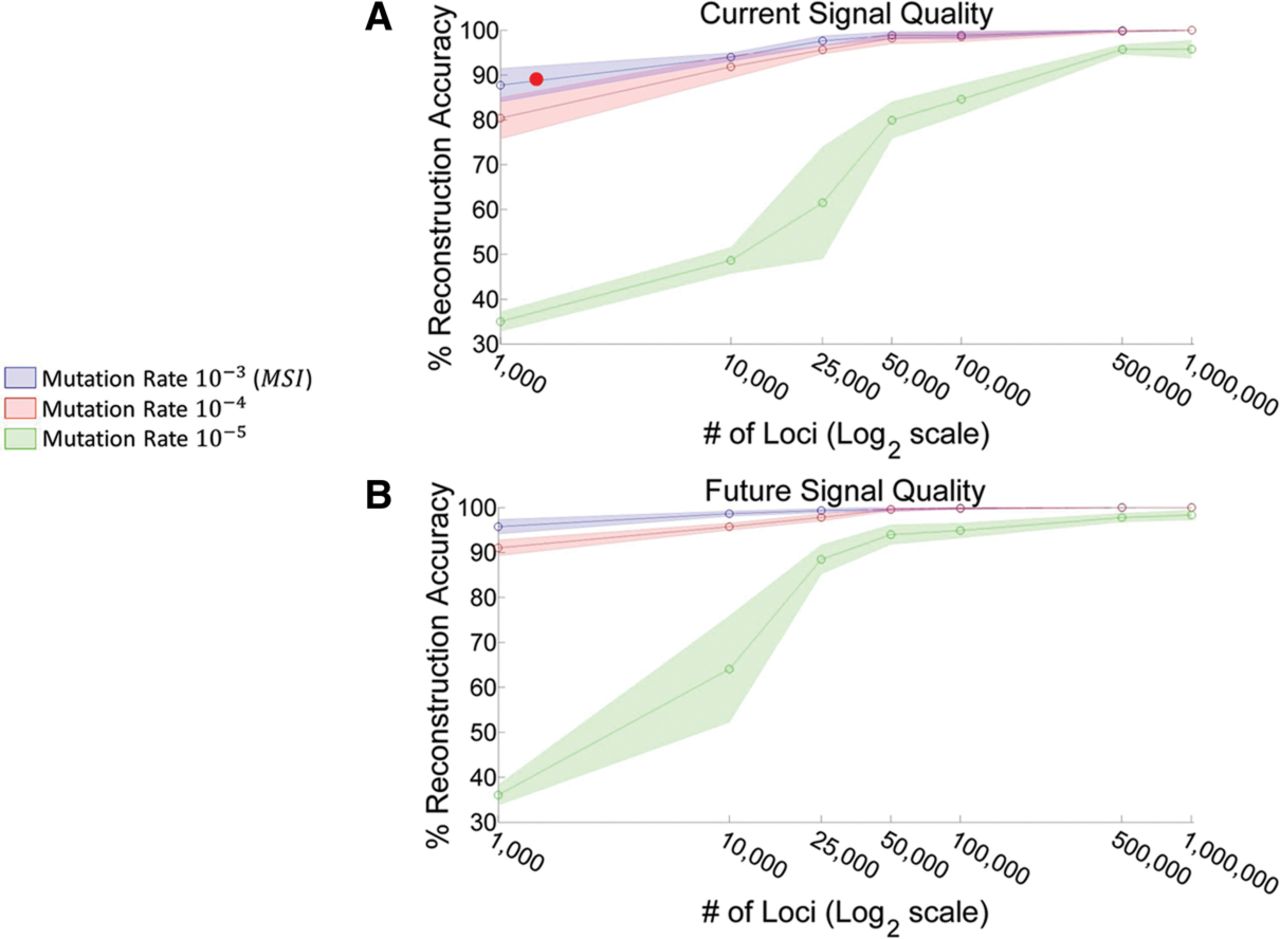
Reconstruction accuracy as a function of the number of MS loci of the simulated ex vivo tree (a random reconstructed tree achieves an accuracy of 33%). (A) Reconstruction accuracy as a function of the number of MS loci using current signal quality as calibrated from the ex vivo experiments. Green and red areas represent performance accuracy of normal cells (medium and lower mutation rates), whereas the blue area represents accuracy of MSI cells (higher mutation rate). Note that the signal quality of MSI cells is lower than that of the normal cells due to chromosomal aberrations. The red circle indicates performance of the current ∼2000 loci panel as applied to the cancer ex vivo experiment. (B) Same as A but using improved signal parameters (less noise and less dropout) expected in the future. Inner lines represent average results over 10 simulations and shaded areas represent the standard deviation.


