
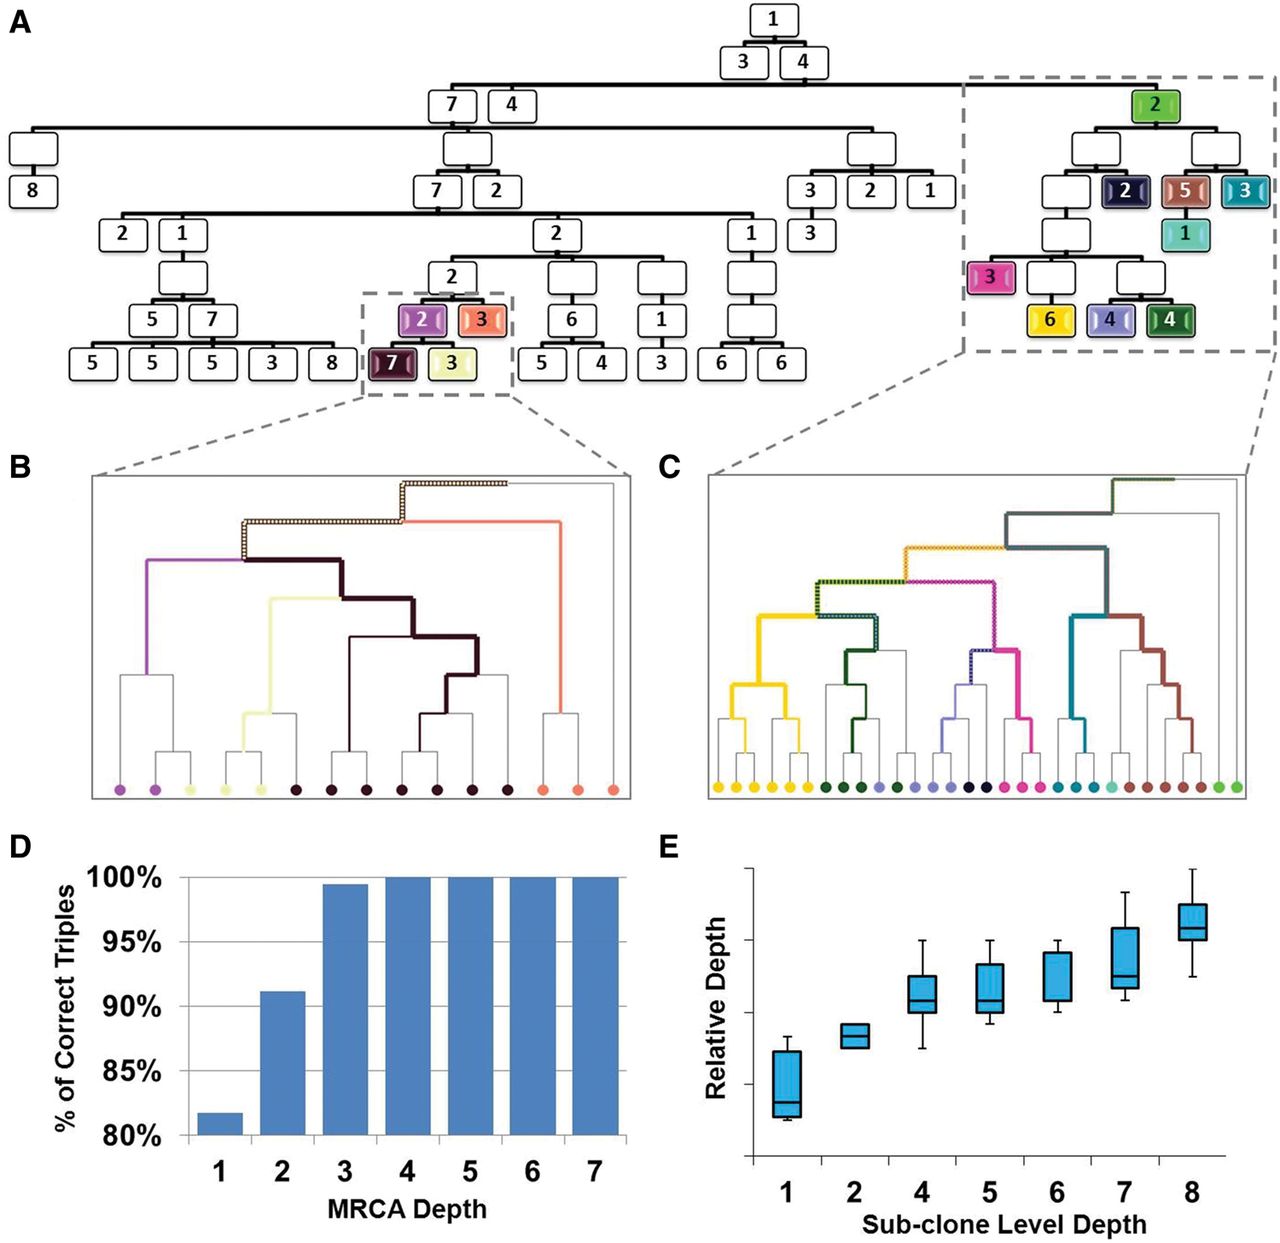
Reconstruction of the cancer ex vivo SC clone tree using the parameters that were calibrated using the simulations. (A) A schematic representation of the known cancer ex vivo SC clone tree. The numbers within the boxes indicate the number of single cells sampled from the specific subclone (total of 167 samples). (B,C) Close-up view of the indicated reconstructed subtrees. Edge colors in the reconstructed tree indicate statistically significant clustering as described in Shlush et al. (2012) and match the box colors of the subclones in A. Trees are drawn as ultrametric (all leaves are equidistant from the root) for clarity. The full, reconstructed tree can be found in Supplemental Figure S14. (D) Percentage of correct triples as a function of the length between the two MRCAs of the triple (see Supplemental Figs. S18, S19). The overall average score is 89%. (E) Correlation between the reconstructed cell depth, corresponding to the number of cell divisions from the root, and the subclone level.


