
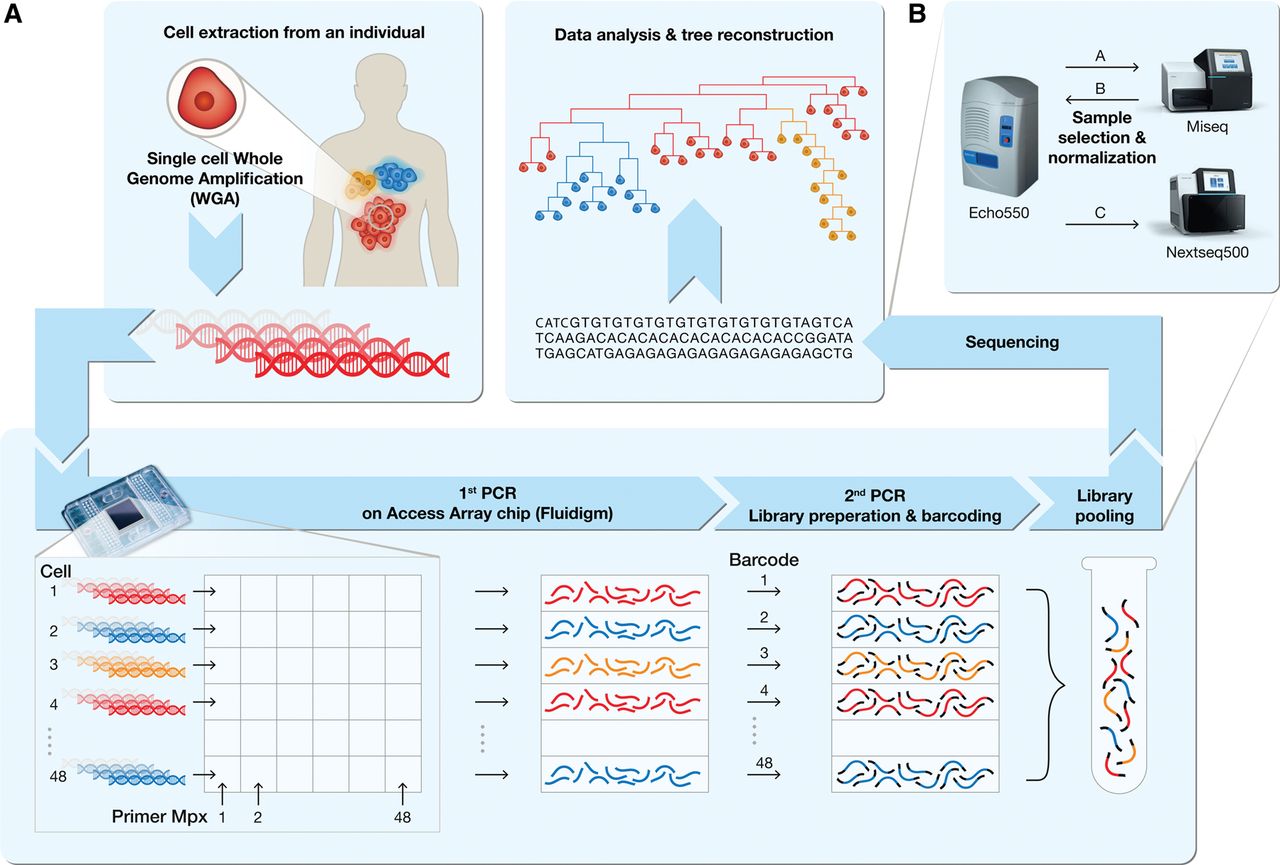
A schematic pipeline of the single-cell lineage analysis platform. (A) Tumor and metastases are given as an example for the utilization of the platform to study cancer dynamics (red, yellow, and blue cell populations). (Top left box) Single cells are extracted from an individual, and DNA is extracted and amplified using whole-genome amplification (WGA). (Bottom box) The amplified DNA from the cells to be analyzed as well as PCR primer pairs in multiplex groups are fed to an Access Array microfluidic chip (Fluidigm). The first PCR targets thousands of specific loci (mainly MSs) from each single-cell DNA. All PCR products of the same cell are harvested into a single well. The second PCR adds a universal sequence at both sides of the first PCR products, where each sample is barcoded with a unique set of primer pairs, resulting in a sequencing-ready library. Pooling the libraries and sequencing them (top right box) enables the analysis and reconstruction of the cell lineage tree. An elaboration of the process is described in the Methods section and Supplemental Figures S1 and S2. (B) Schematic representation of the normalization intended for equalization of reads distribution between samples in a multiplexed NGS run. (A) An equal volume of samples at equal concentrations is pooled and sequenced in a low-coverage sequencing run (Miseq, Illumina). (B) Volume normalization according to user-defined parameters is performed, and (C) another cherry picking is carried out according to normalized volumes (see Supplemental Fig. S6).


