
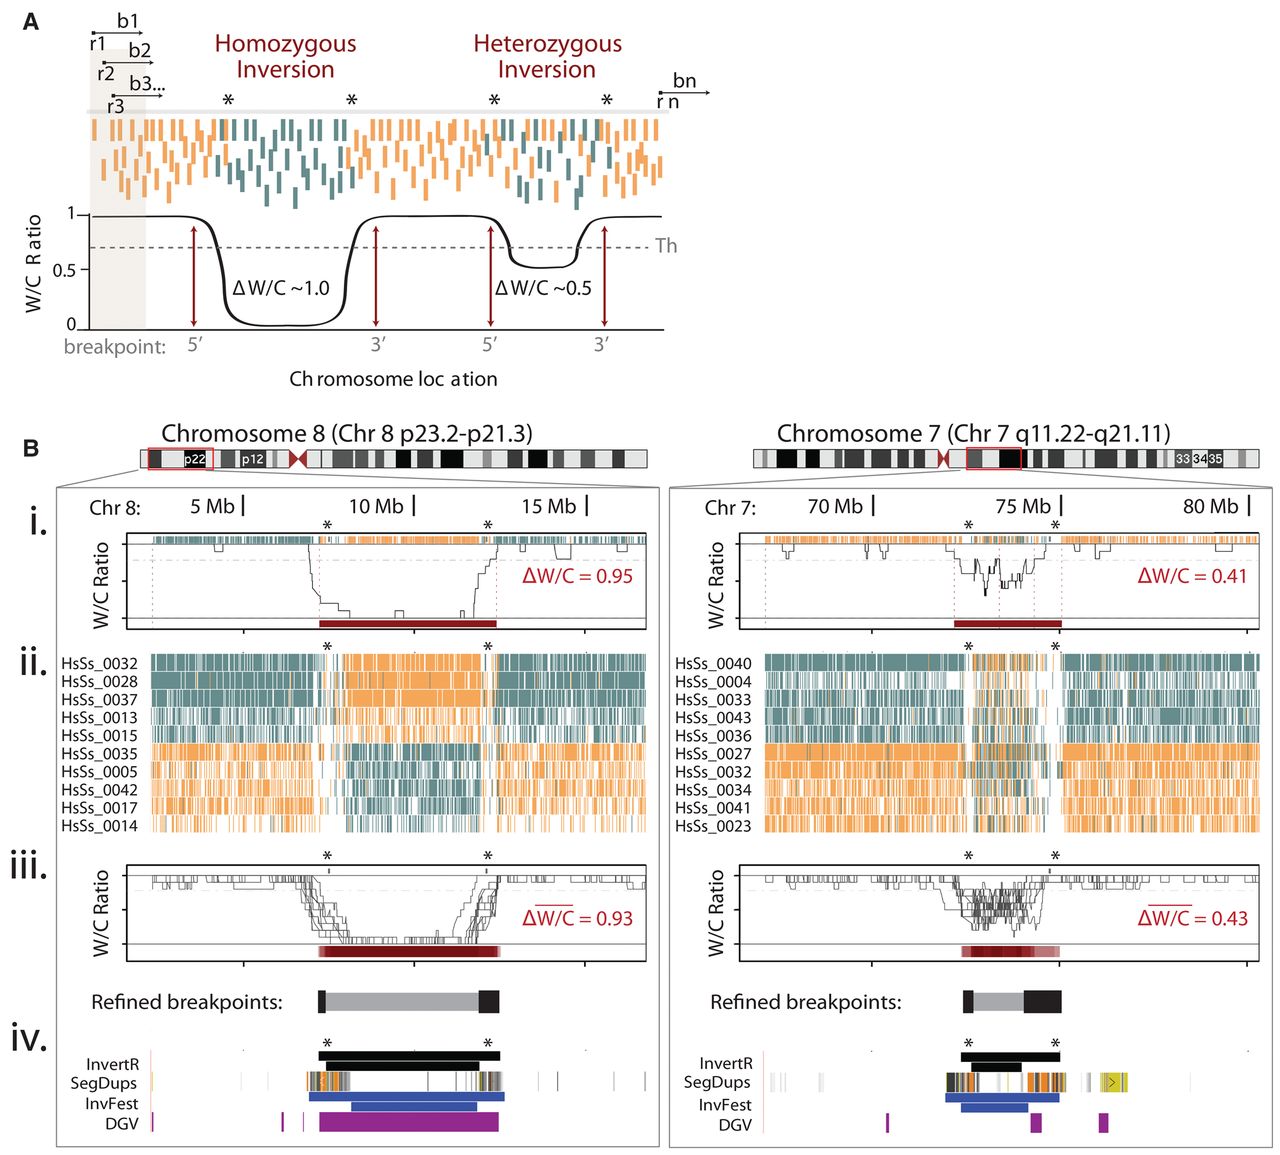
High-throughput characterization of inversions in multiple single cells using Invert.R. (A) Illustration of Invert.R, which steps along each read (r) to survey a user-defined bin (b) and calculates the proportion of Watson (W, orange) and Crick (C, teal) reads (W/C ratio). The bin moves sequentially (b1 to bn) along every read (r1 to rn), and the W/C ratio calculation is repeated and plotted as a histogram (black line). Putative inversions are localized to the genomic region (breakpoints) where the W/C ratio passes a threshold (Th) and genotyped based on the magnitude of change (Δ W/C) at the inverted segment. (B) Zoom of localized Invert.R histograms and corresponding Strand-seq libraries of a homozygous (Chr 8p23; left panel) and heterozygous (Chr 7q11; right panel) inversion, viewed in UCSC Genome Browser (red box). (i) Invert.R output of a single library (shown in Fig. 1E) with predicted breakpoints (dotted lines) and corresponding ΔW/Cs of each inversion (red bar). Asterisks denote regions with low read depth that often flank inversions. (ii) UCSC Genome Browser view of 10 additional libraries from the same donor (iii) with overlaid Invert.R histograms. Sequence gaps (gray bars above histograms) and a heat map of the overlapping inversion predictions (red bars below histograms) are included. The minimal inverted region (inverted segment predicted in 80% of cells, gray bar below histogram) and flanking breakpoint ranges (inverted segment predicted in 20% of cells, black bars below histogram) calculated from all 10 cells. This placed the breakpoint ranges to 7,183,914–7,404,466 (5′) and 11,880,370–12,489,771 (3′) for the Chr 8 inversion, and 72,380,014–72,659,960 (5′) and 73,989,814–75,007,165 (3′) for Chr 7. (iv) Simultaneous view of inversions mapped by Invert.R (black), in relation to segmental duplications (SegDups), and previously reported inversions in the Database of Genomic Variants (DGV, purple) and the Human Polymorphic Inversion Database (InvFest, blue). For Invert.R and InvFest, the minimal inverted region is represented as the lower bar in the track, with the maximal inverted regions (outermost breakpoint ranges) represented as the upper bar.


