
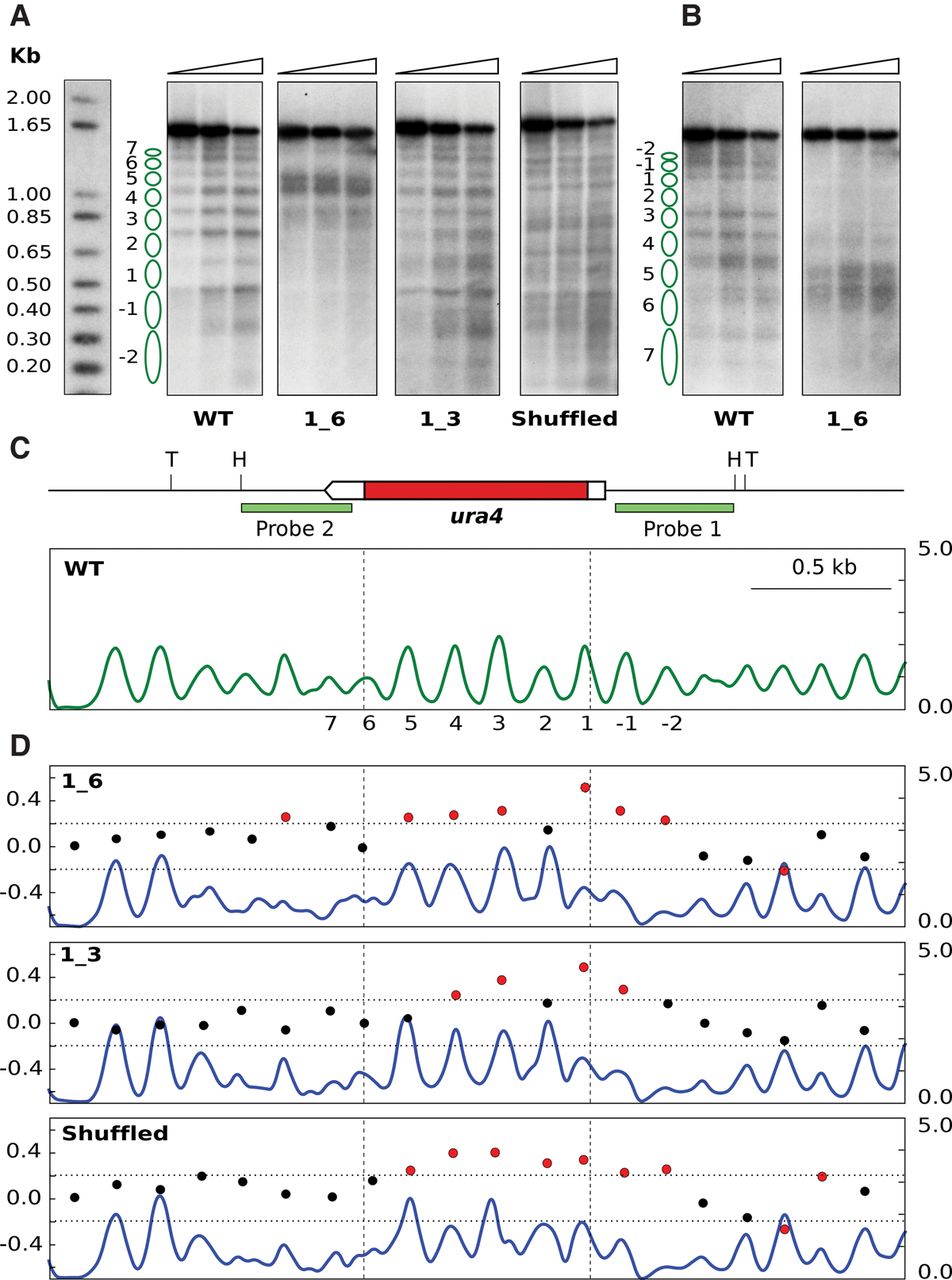
Sequence changes destabilize nucleosome positioning in the ura4 gene. (A) Chromatin from wild-type cells (WT) and from the indicated mutant strains were digested with increasing amounts of MNase (triangles) prior to digestion with HindIII or TfiI (Shuffled). Samples were electrophoresed, blotted, and hybridized to probe 1, shown in C. (B) WT and 1_6 membranes in A were stripped and rehybridized using probe 2. Some controls of naked DNA digested with MNase, and of chromatin incubated without MNase, are shown in Supplemental Figure S8. Similar controls were carried out for all the remaining MNase experiments. (C) Diagram of the analyzed region. The ura4 gene is represented by a pointed rectangle, and the coding region is shown in red. Restriction sites for HindIII (H) and TfiI (T) and the localization of the hybridization probes are indicated. The nucleosome occupancy map of wild-type cells generated by MNase-seq is shown in green. The y-axis indicates occupancy normalized to the genome average. Vertical dashed lines indicate the position of the ura4 ORF. Nucleosomes are numbered as in A. (D) Nucleosome occupancy map of the 1_6, 1_3, and Shuffled strains (blue) and DANPOS analysis. Left y-axis indicates the log2-fold difference in fuzziness in the analyzed region. Red dots represent values above or below 2σ (horizontal dotted lines) of the distribution of this difference between the three modified ura4 versions and the WT. Right y-axis indicates nucleosome occupancy as in C.


