
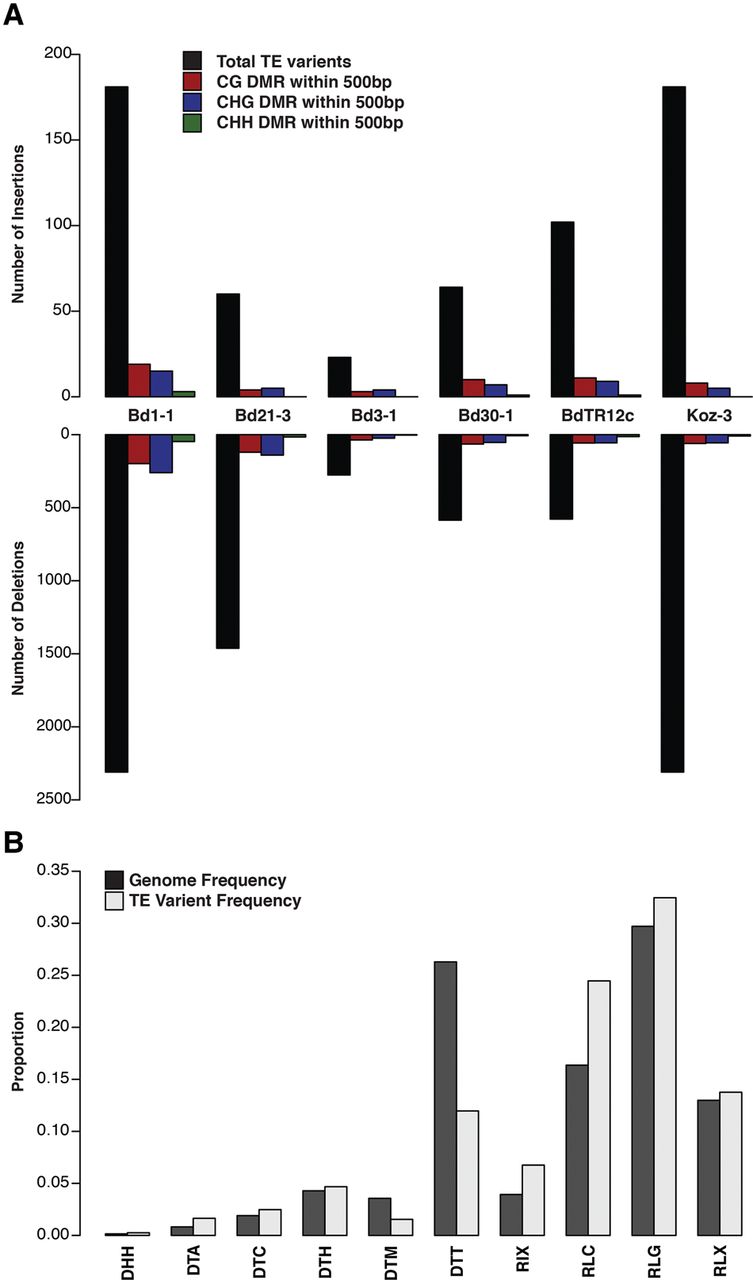
Figure 5.
Transposable element polymorphisms across sequenced lines. (A) Bar plot indicating total number of transposable element insertions and deletions compared to the Bd21 reference along with the number of DMRs found within 500 bp for each sequence context. (B) Bar plot of transposable element families. The genomic frequency of each family (black bars) is compared with the frequency of identified TE insertions and deletion (gray bars).


