
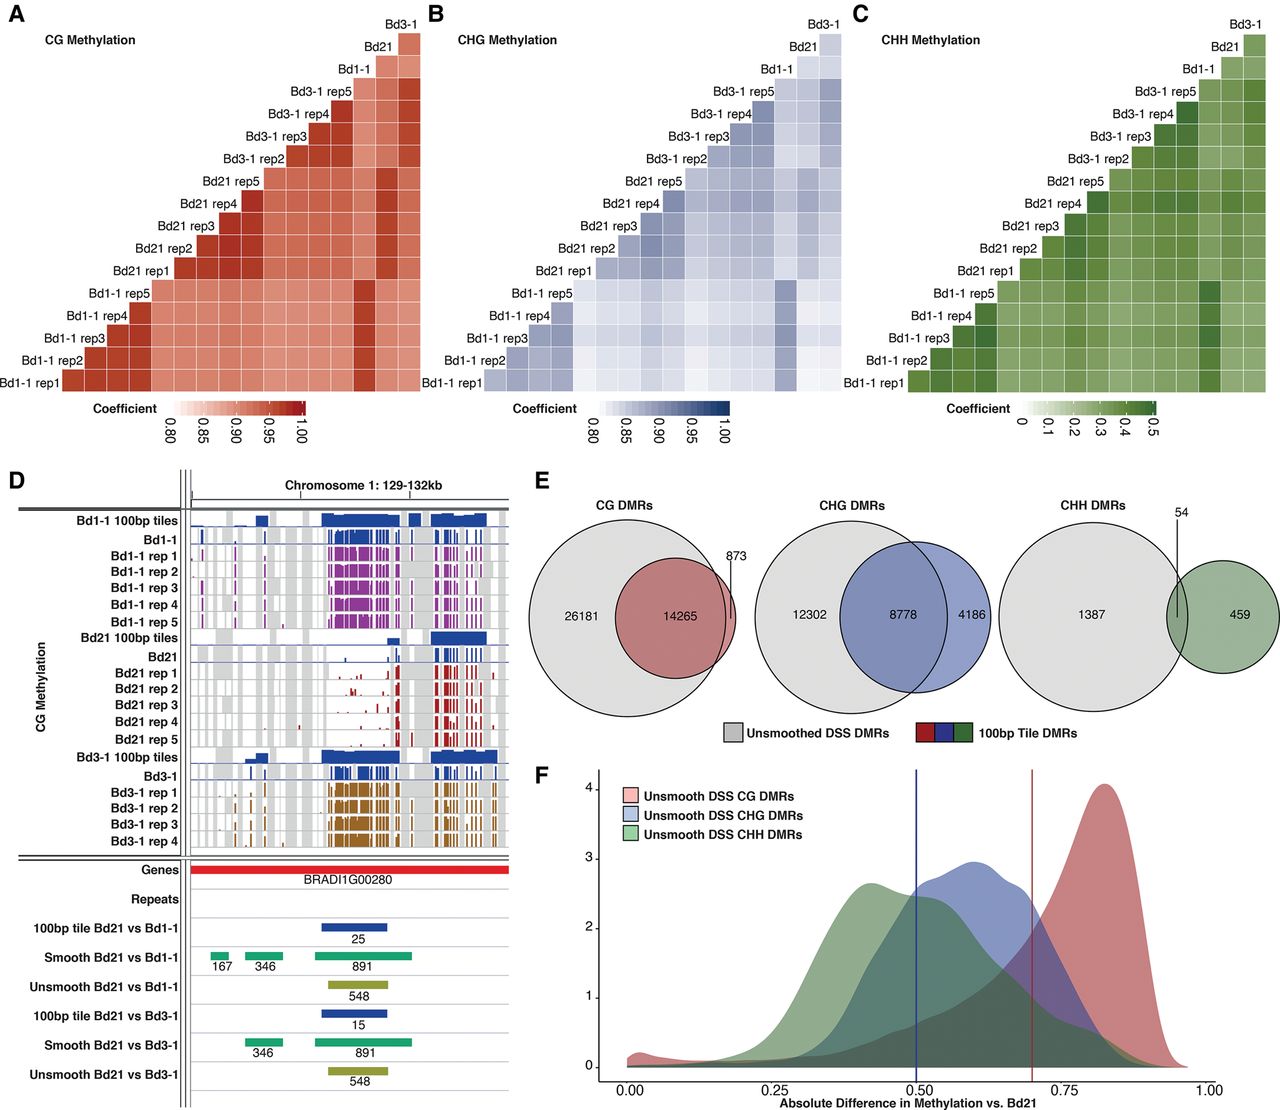
Comparisons of biological replicates of whole-genome bisulfite sequencing. (A–C) Pearson correlation plots of all genomic cytosines with coverage: (A) CG; (B) CHG; (C) CHH methylation. Note different scale for CHH methylation compared with the other two contexts. (D) Genome view of a CG DMR highlighting the 100-bp windowing (blue), smooth DSS (green), and unsmooth DSS (olive) DMRs called. Tracks of cytosine methylation, scaled 0%–100%, are shown along with matching experimental sample and resulting 100-bp window track. (E) Venn diagrams of unsmoothed DSS-based DMRs compared to 100-bp tile-base DMRs for CG, CHG, and CHH DMR sets. All DMRs for both Bd1-1 and Bd3-1 comparisons to the reference were included. (F) Density distribution of methylation differences between accession groups in unsmoothed DSS DMRs. Red vertical bar indicates fixed cutoff for 100-bp CG DMRs. Blue vertical bar indicates fixed cutoff for 100-bp CHG DMRs.


