
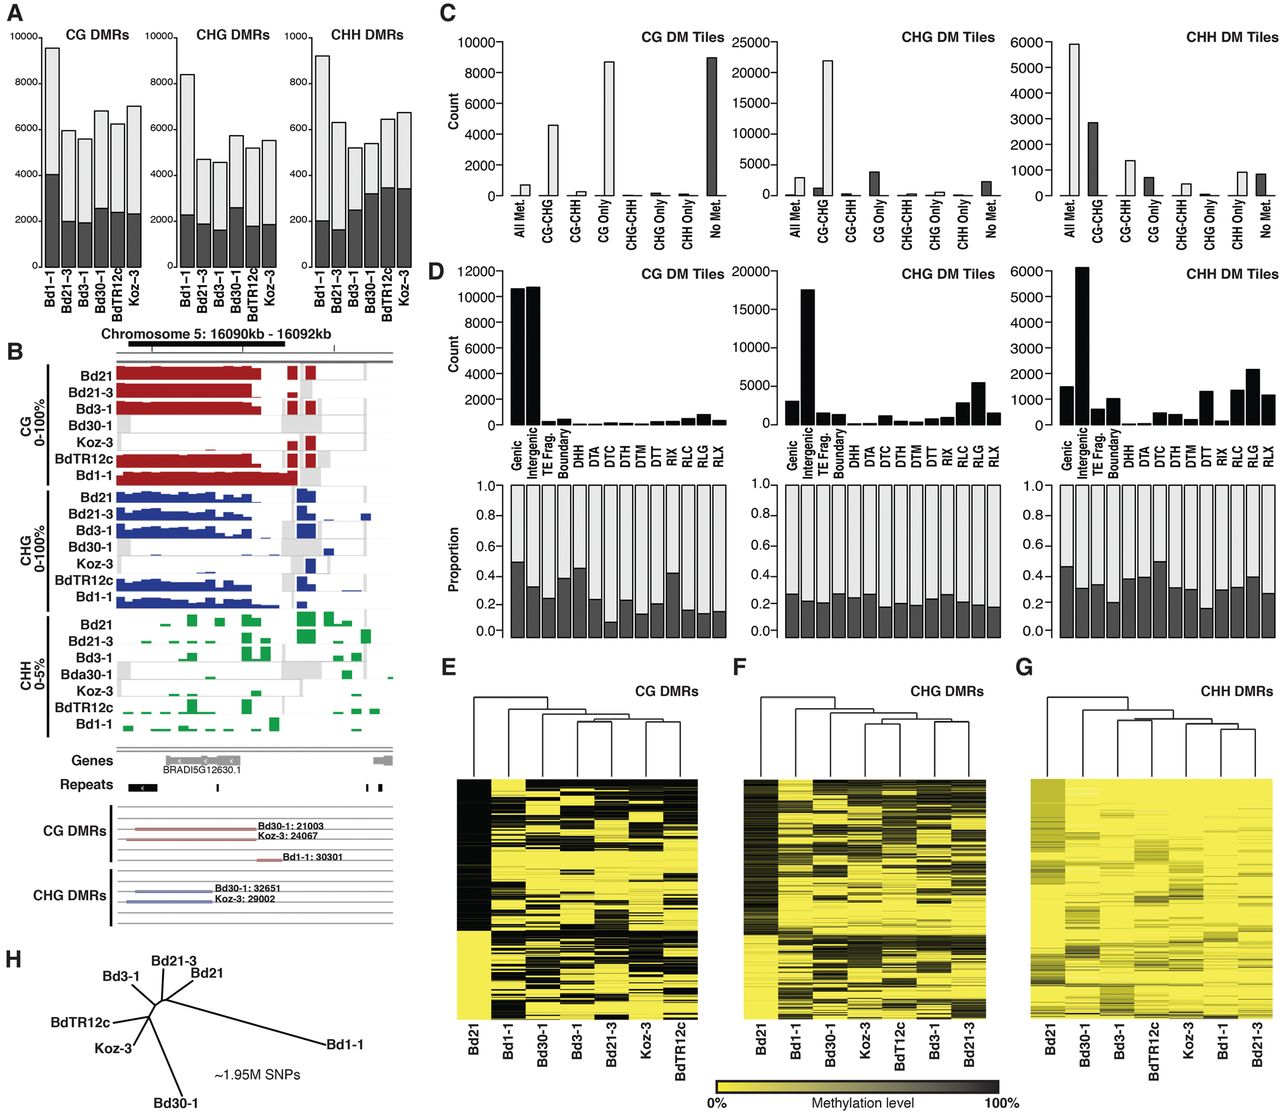
Differential methylation across Brachypodium inbred lines. (A) Total number of CG, CHG, and CHH DMRs classified for each of the six diverse inbreds. Gray and black indicate low and high methylation compared to Bd21, respectively. (B) An example DMR with 100-bp averaged methylation profiles for all seven inbreds. Gene and repeat models are provided below. Bd30-1, Koz-3, and Bd1-1 CG/CHG DMRs are highlighted. Gray windows indicate regions of no data (no read coverage). (C) Number of differentially methylated tiles across eight Bd21 methylation classes. Gray and black indicate low and high methylation compared to Bd21, respectively. (D) The total number of DM tiles (top) and proportion of low (gray) and high (black) methylation for DM tiles (bottom) across genomic annotation classes. (E–G) Hierarchical clustering of all identified CG, CHG, and CHH DMRs. Dendrogram indicates overall similarity between samples. Given all DMRs discovered against Bd21, Bd21 acts as an outgroup in this analysis. (H) Neighbor-joining tree of the seven reference lines based on 1.95 million SNPs with calls for all samples. SNPs encoded as Bd21 or alternate.


