
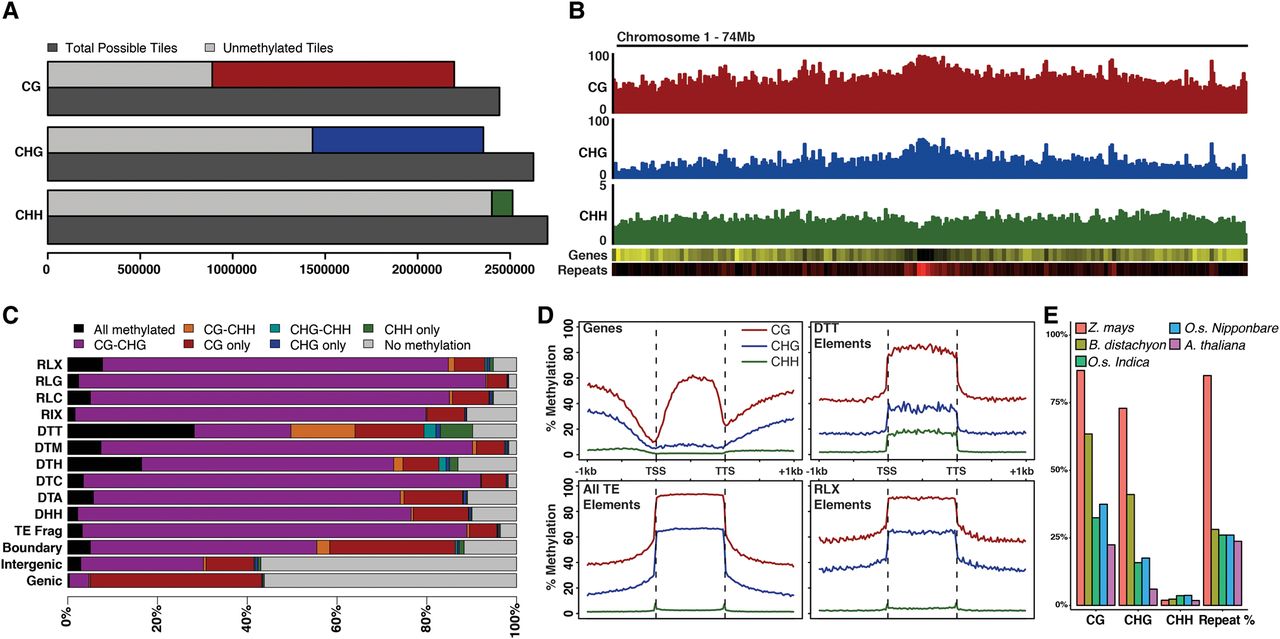
Genomic profiles of DNA methylation of Brachypodium distachyon. (A) Total number of 100-bp genomic tiles (dark gray) are compared to the number of genomic tiles with sequence coverage for all three methylation sequence contexts. Coverage bar is split between unmethylated tiles (light gray) and methylated tiles: (red) CG; (blue) CHG; (green) CHH. (B) Chromosome profile of average methylation in CG, CHG, and CHH contexts. Gene density (yellow high) and repeat density (red high) are also shown. (C) Percentage bar plot of genomic tile annotation states within the genome. Bars are divided by eight possible Bd21 methylation states. Retrotransposable superfamilies are indicated by an “R” prefix and DNA elements indicated by a “D” prefix. (D) Relative methylation of annotated genes, all transposons, DTT transposons only, and RLX transposons only. Flanking 1 kb of genes and repetitive elements are also shown outside the dashed vertical lines. (E) Average level of CG, CHG, CHH, and proportion of genomes consisting of repetitive sequences across the genome of various grass species.


