
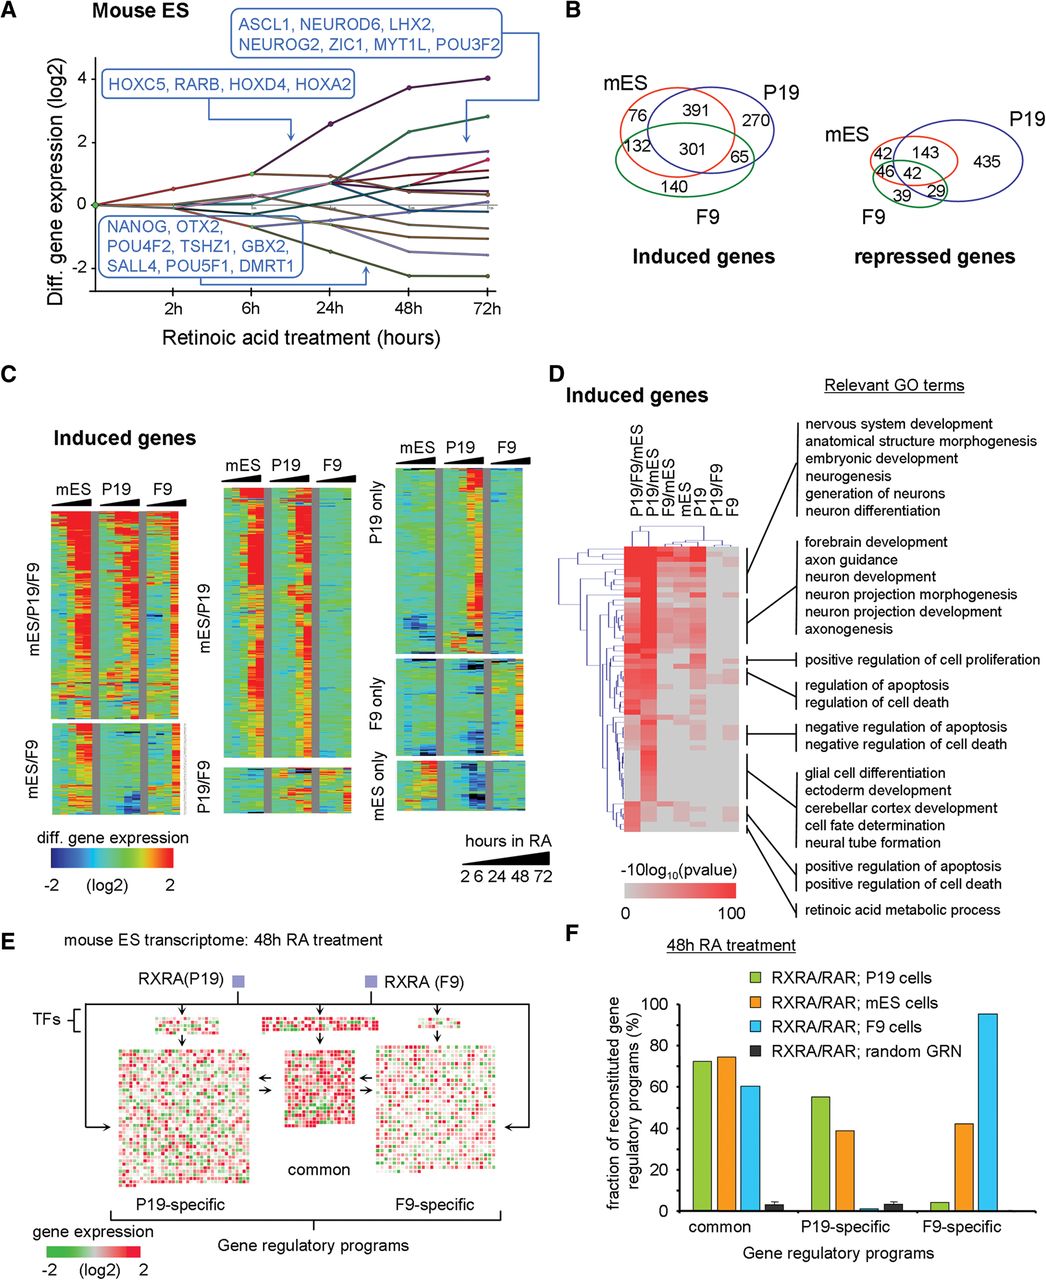
Relevance of the inferred GRP in EC cells in comparison to the mouse ES model system. (A) Dynamic regulatory map reconstructed from publicly available temporal transcriptome data of RA-treated mES cells. (B) Venn diagram illustrating the number of DEGs shared with either P19 or F9 cells during the RA-induced program (all time points included). (C) Temporal mRNA gene expression levels (heat map; induced genes) associated with each of the cell model systems and displayed based on the classification in B (for repressed genes, see Supplemental Fig. S18). (D) GO analysis of induced genes displayed in B. (E) Genes expressed in mouse ES cells after 48 h of RA treatment revealing common and F9-/P19-specific programs and color-coded according to their expression levels relative to the noninduced state. Genes composing all three GRPs are regulated in ES cells, despite the expected neuronal cell fate commitment. (F) Fraction of reconstituted GRPs in all three cell systems (after 48 h of RA treatment). Note that in mouse ES cells, both the P19- and F9-specific programs are induced at a level of ∼40%; this contrasts with the much more specific neuronal and endodermal programs in P19 or F9 cells, respectively.


