
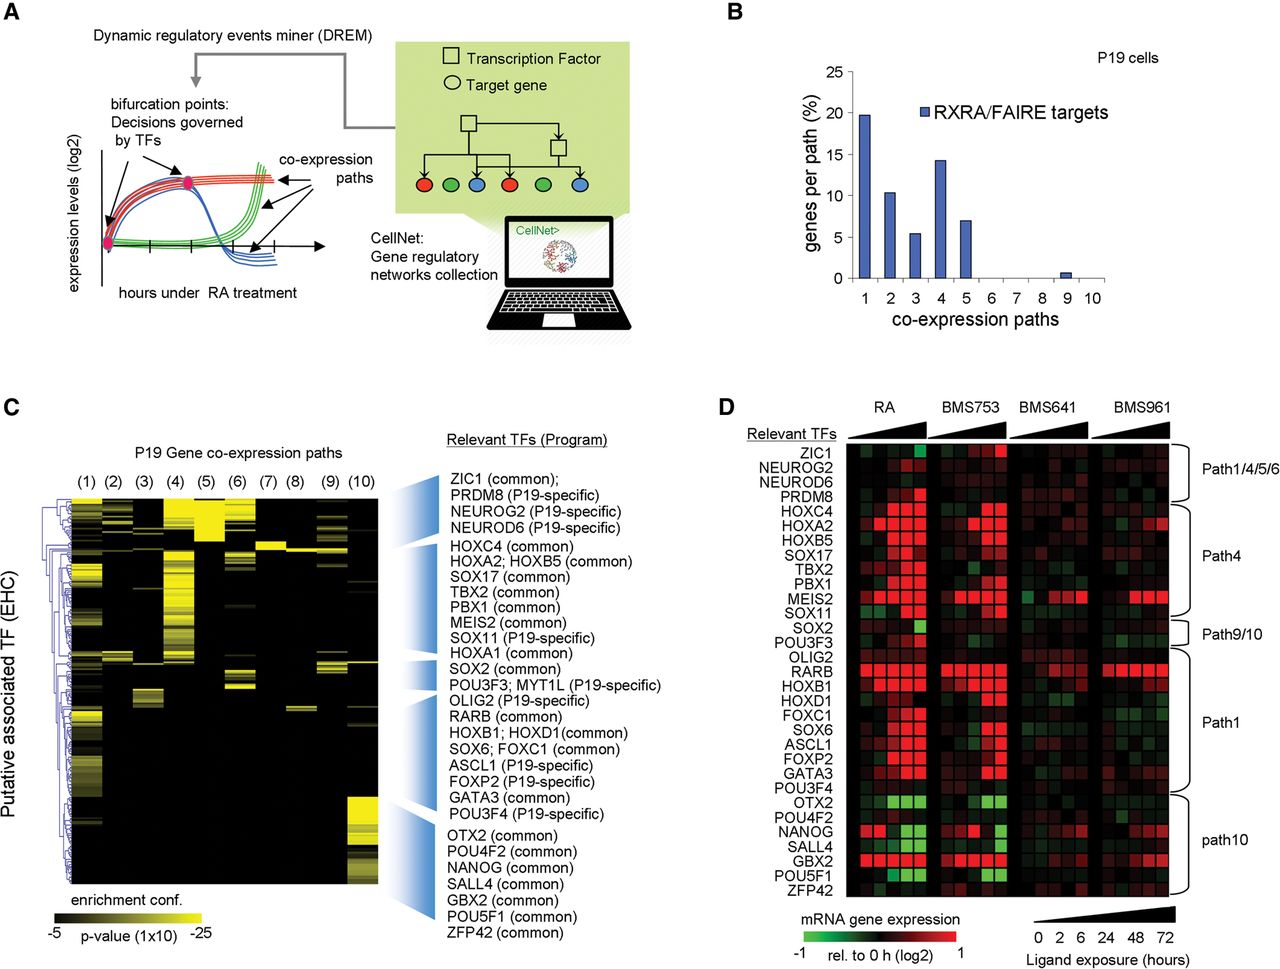
Inferring relevant TF-TG relationships during RA-induced neuronal cell fate transition. (A) Scheme of the strategy applied by DREM to integrate static TF-TG regulatory relationships with the temporal gene coexpression paths. In addition, the information provided by the CellNet collection and the RXRA binding/FAIRE site information have been integrated. (B) Bar graph depicting the fraction of RXRA and FAIRE TGs in each coexpression path assessed in P19 cells during the RA-induced differentiation. (C) TFs’ enrichment per coexpression path in P19 cells as predicted by DREM (hypergeometric distribution probability). The heat map illustrates the enrichment confidence per coexpression path for each of the most confident TF associations (CellNet database) further classified by Euclidean hierarchical clustering (EHC). On the right, the identity of relevant TFs per cluster and their implication in common and endodermal (F9)-/neuronal (P19)-specific gene programs is displayed. (D) mRNA expression levels of relevant TFs displayed in C assessed with either RA or RAR-specific agonists.


