
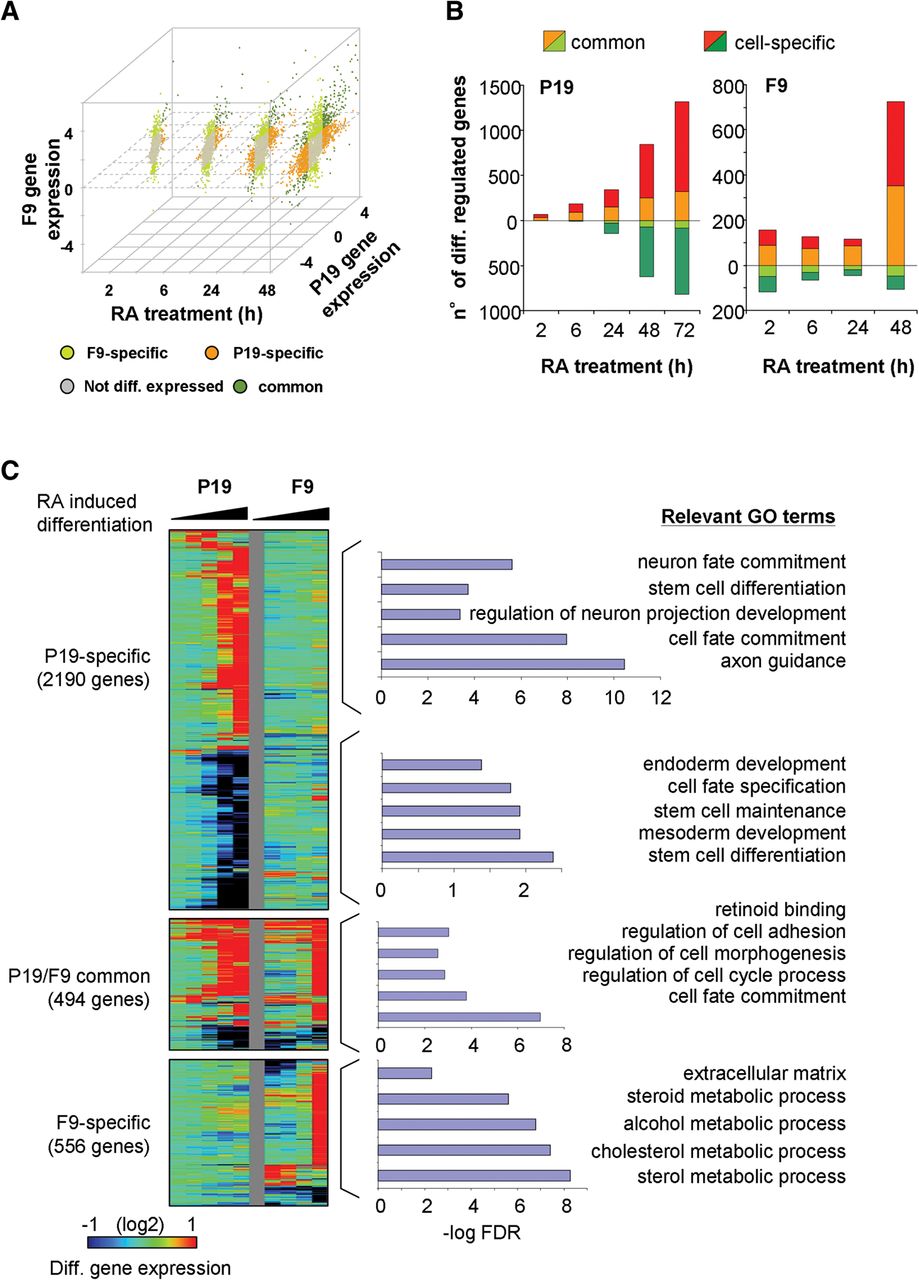
Common and specific RA-induced differentiation programs characterized in F9 and P19 embryonal carcinoma cells. (A) Scatterplot illustrating transcriptome changes in F9 and P19 EC cells at different time points during RA-induced differentiation. Gene expression levels relative to the undifferentiated state were classified as common, EC-specific, or not differentially expressed, based on a defined fold change threshold (up-regulated genes, fold change > 1.8; down-regulated genes, fold change < 0.5) at a given time point. (B) Differential gene expression levels in both model systems were used for computing the number of differentially regulated genes (y-axis) at various time points covering the first 72 h of RA treatment (x-axis). DEGs were classified as either commonly or cell-specifically expressed. This classification takes into consideration the gene expression response over all evaluated time points, in contrast to A, where a classification per time point is performed. (C) Temporal changes in transcriptional expression in either F9 or P19 EC cells are displayed for common and cell type-specific genes. Relevant GO terms per common or cell type-specific group of genes are displayed.


