
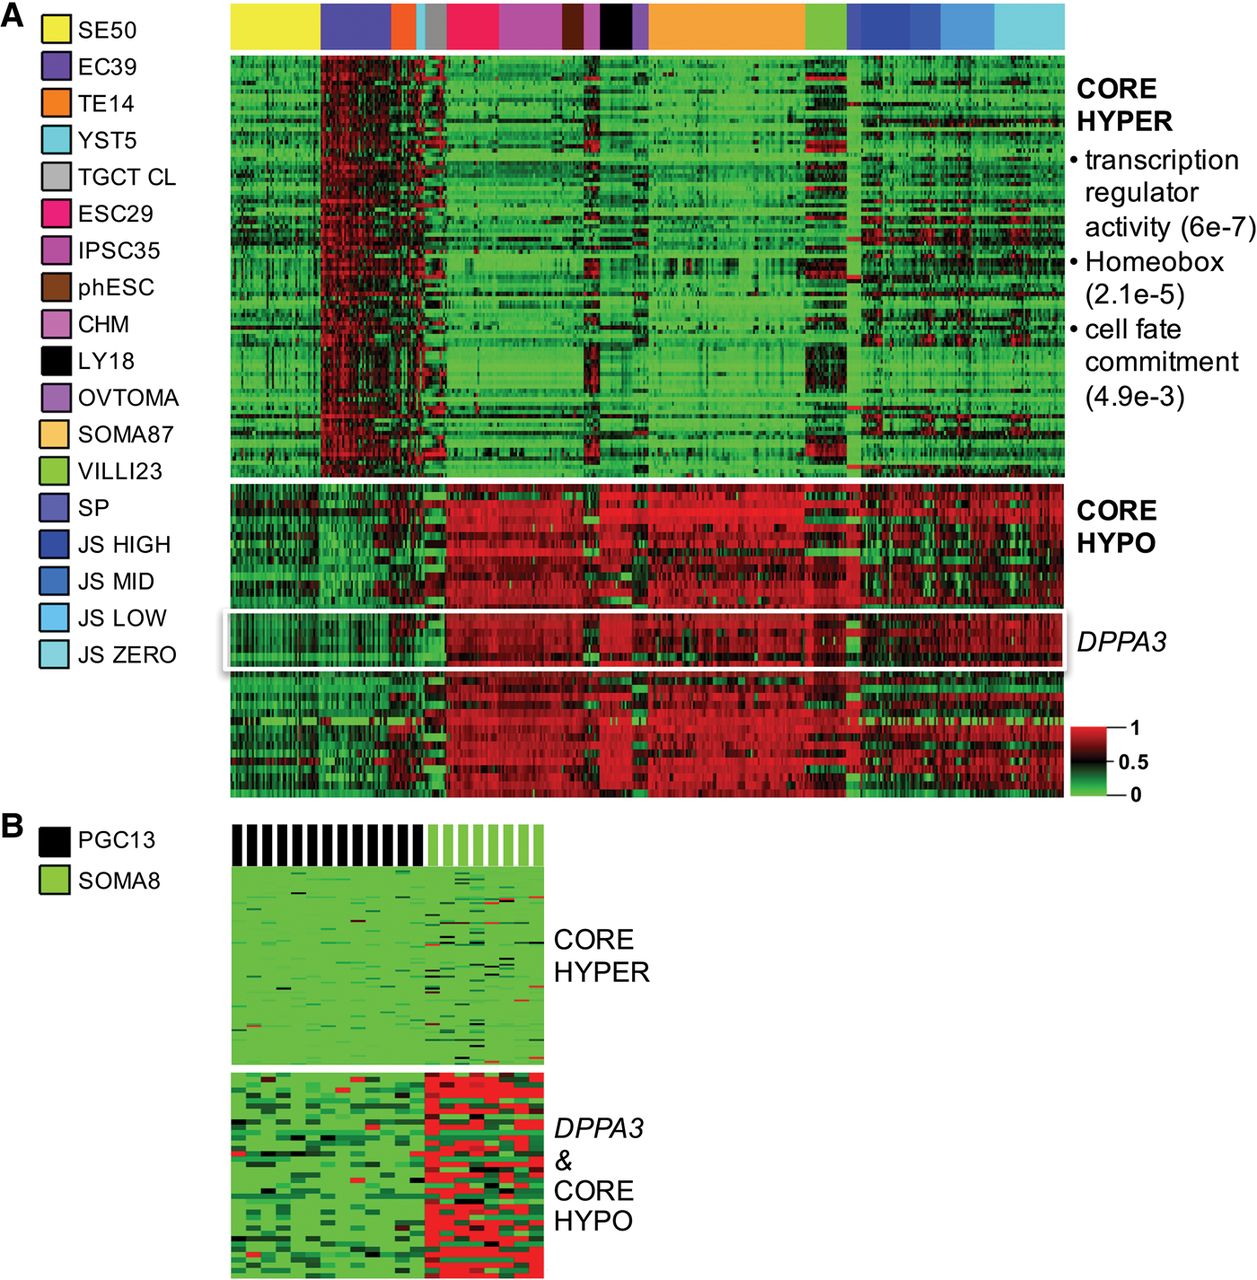
Core TGCT methylation. The nonseminomas (ECs, TEs, and YSTs) were collectively compared with reference samples. (A) Heatmap of the TGCT core hypermethylation module (“core hyper,” n = 100 targets) (Supplemental Table S3) across the four TGCT subtypes and multiple references. SEs show erasure for the otherwise TGCT-hypermethylated module, as shown in this unclustered heatmap. Functional annotation of core hypermethylated genes using the DAVID Functional Annotation Clustering Tool revealed significant enrichment for transcription regulatory, homeobox, and cell fate commitment genes (FDR shown in parentheses at right). Among the “core hypo” targets (Supplemental Table S3), seven of 39 targets map to DPPA3. (B) PGCs are erased for both core hyper- and hypomethylated targets, while embryonic somatic tissues serve as an internal control and show inverse methylation of the modules relative to TGCTs. For abbreviations used, see text.


