
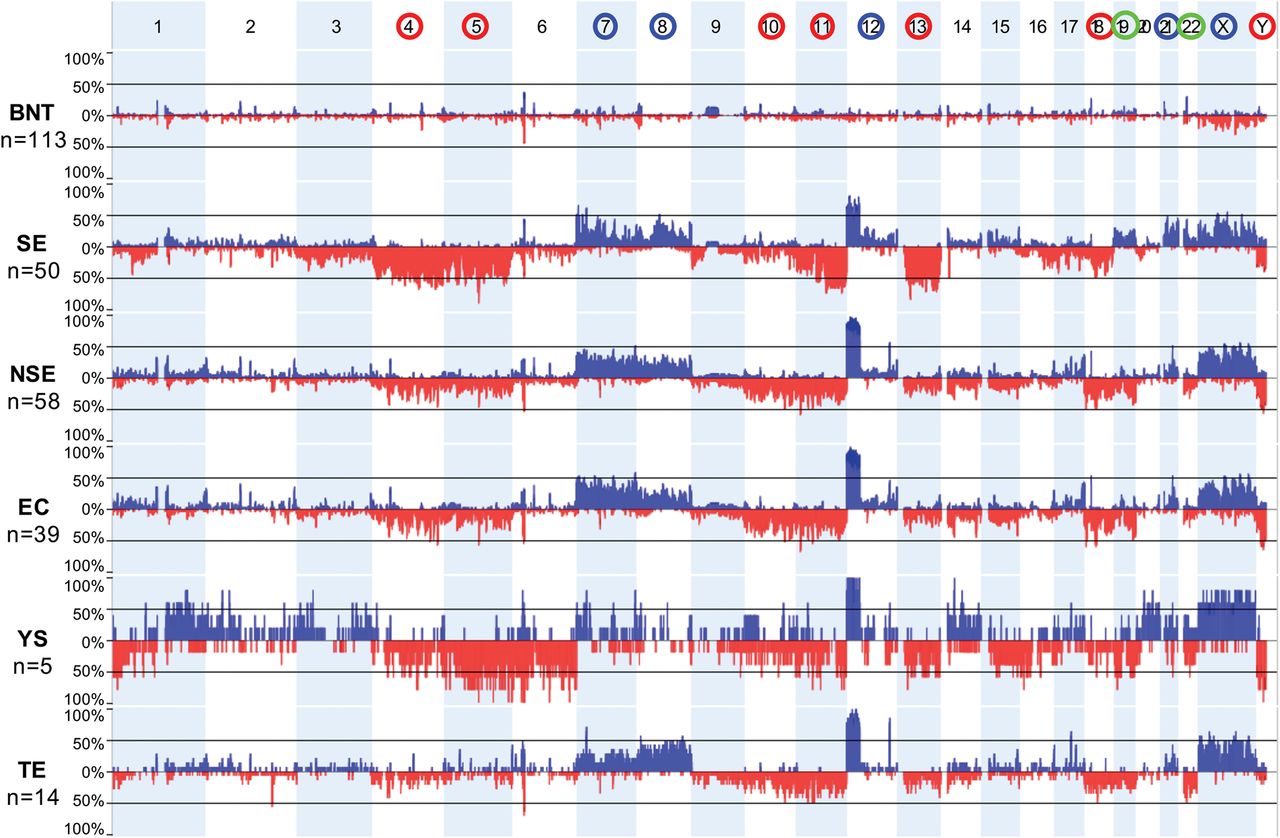
Figure 1.
Somatic copy number aberration (SCNA) profiles in TGCT subtypes. (Top) Blue and red circles around chromosome numbers indicate recurrent shared SCNA gains and losses, respectively; green circles, chromosomes relatively gained in SE versus NSE. (Next three panels) Aggregate view of BNTs, SEs, and NSEs. (Bottom three panels) NSEs were further subtyped as EC, YST, and TE. SCNAs were computed from 450K-methylation array signal intensities (see Methods). Tumor inclusion criteria required the presence of gain of the short arm of Chromosome 12p. For abbreviations used, see text.


