
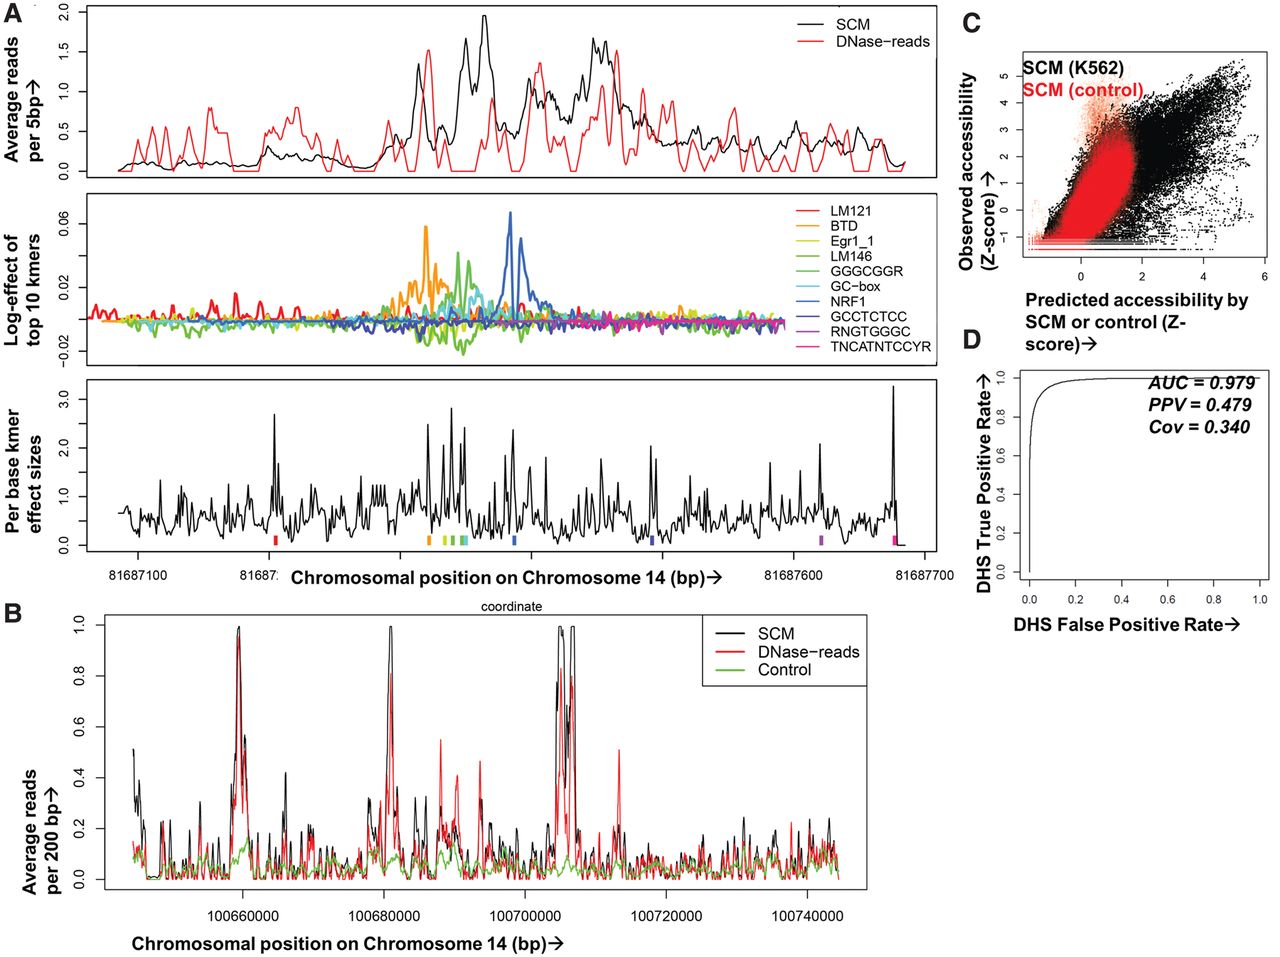
Multiplicative effects of local k-mers accurately predict chromatin accessibility. (A) A SCM uses DNase-seq data on training chromosomes and iterative machine learning methods to compute spatial profiles for each k-mer, optimizing a model in which nearby k-mer effects multiply to predict DNase-seq reads for held-out chromosomes. In this example representing a genomic region containing an NRF1 binding site, the top panel shows single base resolution predicted (black) and 5-bp smoothed observed DNase-seq data (red) across a 600-bp window. The middle panel shows the SCM-predicted spatial contribution of the top 10 k-mers in log-units and matched motifs in the legends; the teal peak corresponds to the NRF1 binding footprint. The bottom panel shows a measure of importance of each base by the k-mer starting at that position summed over the entire spatial range of k-mer influence with colored tick marks for the top 10 k-mers. Note that SCMs multiply effects of thousands of overlapping k-mers at each site, so the top k-mers do not lead to the SCM predictions in a straightforward manner. (B) Example human K562 held-out genomic region showing DNase-seq reads (red), SCM-predicted reads (black), and reads from a control model trained on IMR-90 naked DNA DNase-seq data (green) (Lazarovici et al. 2013), all smoothed at 200 bp. (C) Comparison of SCM-predicted (x-axis) and observed (y-axis) DNase-seq reads in 2-kb binned regions of K562 held-out Chromosome 14. Models were trained on K562 DNase-seq data (black) or IMR-90 naked DNA DNase-seq (red). (D) Receiver–operator curve (ROC) showing SCM predictive accuracy after binary calling of DHS in observed and predicted K562 held-out DNase-seq data. The evaluation set was balanced to 5000 positive and negative samples (uniformly taken from positive and negative sets) to avoid AUC inflation due to class imbalance.


