
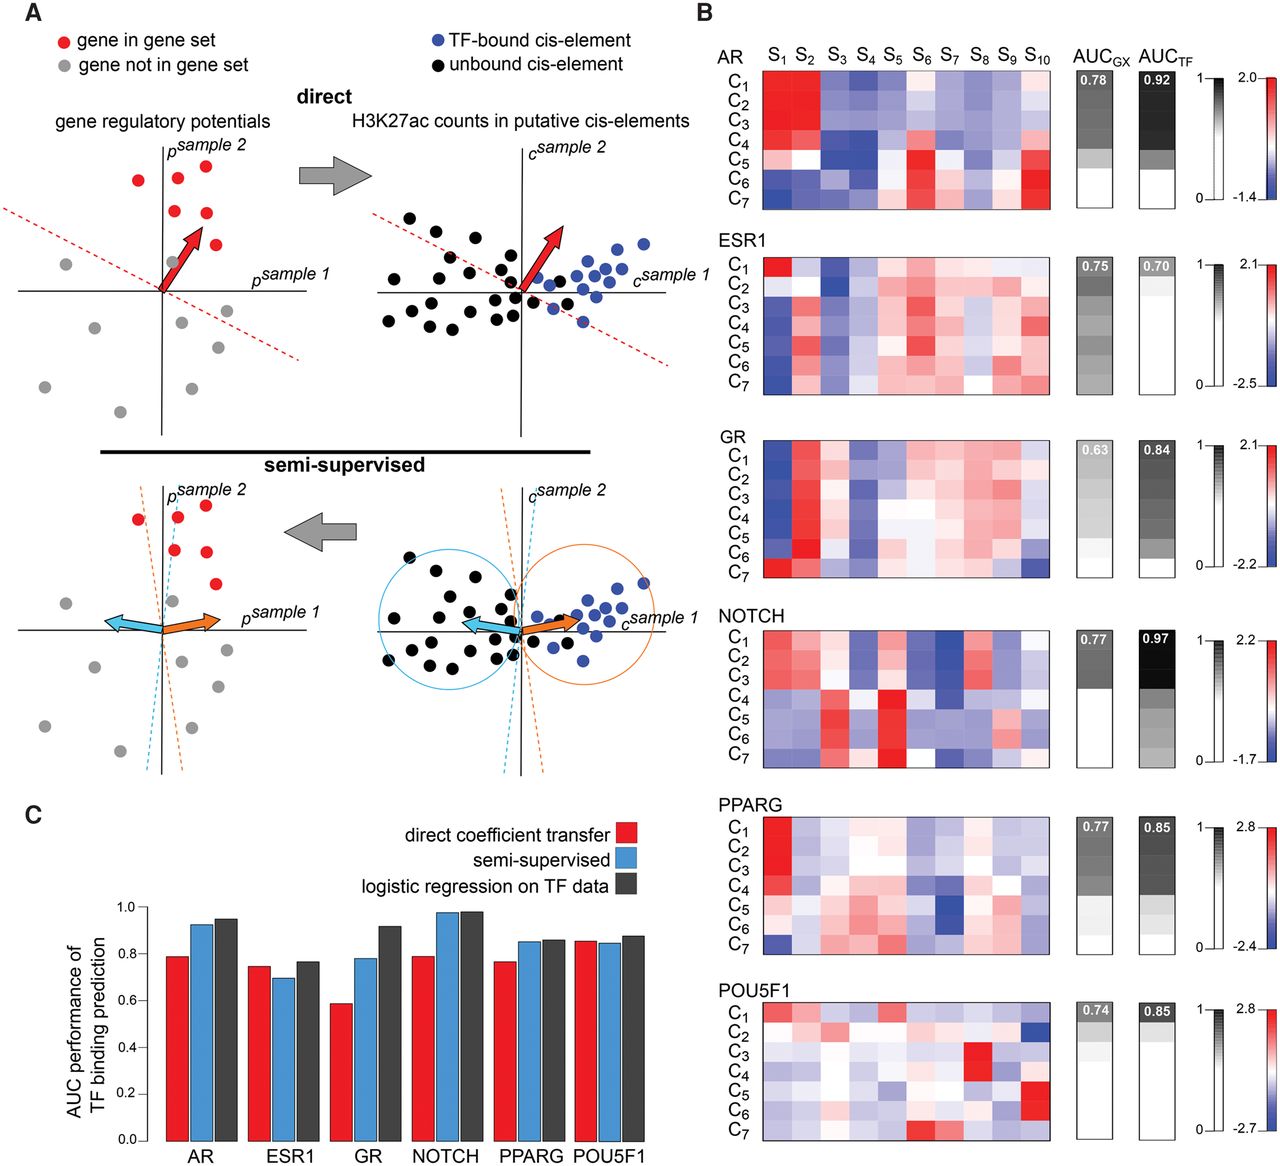
MARGE-cistrome prediction of cis-regulatory regions from gene sets and H3K27ac ChIP-seq data. (A) Schematic of cis-regulatory region prediction through the direct transfer of MARGE-express coefficients from the H3K27ac regulatory potential domain to the domain of H3K27ac signal at UDHS regions (top). In this illustration, we represent a hypothetical case in which two samples are selected to predict gene sets and cis-regulatory regions. Using a supervised classification method (top left), such as logistic regression, we can identify the normal (red arrow) of a hyperplane that best separates genes in the gene set (red dots) from the rest (gray dots). Applied to the union of DNase-seq peaks (top right), this normal may not be the optimal classifier to separate transcription factor binding sites from the remainder of the candidate regions. Schematic of semisupervised learning for cis-regulatory element identification (bottom). Using k-means clustering (bottom right), using only two clusters for illustrative purposes, we can identify the centroids (orange and cyan arrows) of sets of putative cis-regulatory regions that have similar H3K27ac read count patterns across samples. Using gene sets (bottom left), we determine which of the centroid-derived normal vectors (orange arrow) is most predictive of the gene set. The optimal centroid derived vector (orange arrow) is then used to classify TF binding sites associated with the gene set (bottom right). (B) Applied to systems that are regulated chiefly by the respective transcription factors: the androgen receptor, the estrogen receptor, the glucocorticoid receptor, NOTCH, PPARG, and POU5F1, we find the centroids of the k-means clusters (left), predict gene sets (AUCGX , middle) with AUC performance that is highly correlated with AUC performance for the prediction of transcription factor binding sites (AUCTF , right). In these examples, 10 selected samples, S1 … S10, were clustered into seven clusters, C1 … C7. In each system, the samples with the greatest absolute positive and negative regression coefficients are as follows. AR: (S1) dihydrotestosterone-stimulated LNCaP cells, (S2) unstimulated LNCaP cells; ESR1: (S7) estradiol-stimulated MCF-7 cells, (S8) unstimulated MCF-7 cells; GR: (S1) dexamethasone-stimulated A549 cells, (S2) unstimulated A549 cells; NOTCH: (S1) CUTLL1 cells, (S2) γ secretase-inhibited CUTLL1 cells; PPARG: (S1) adipocytes, (S2) expanded memory T-cells; POU5F1: (S1) embryonic stem cells, (S2) embryonic stem cell-derived foregut. (C) In the prediction of TF binding sites from gene sets, the classifiers derived through semisupervised analysis perform better than those derived using the naive direct coefficient transfer approach in four examples, and almost as well as classifiers based on the direct application of logistic regression to transcription factor binding data.


