
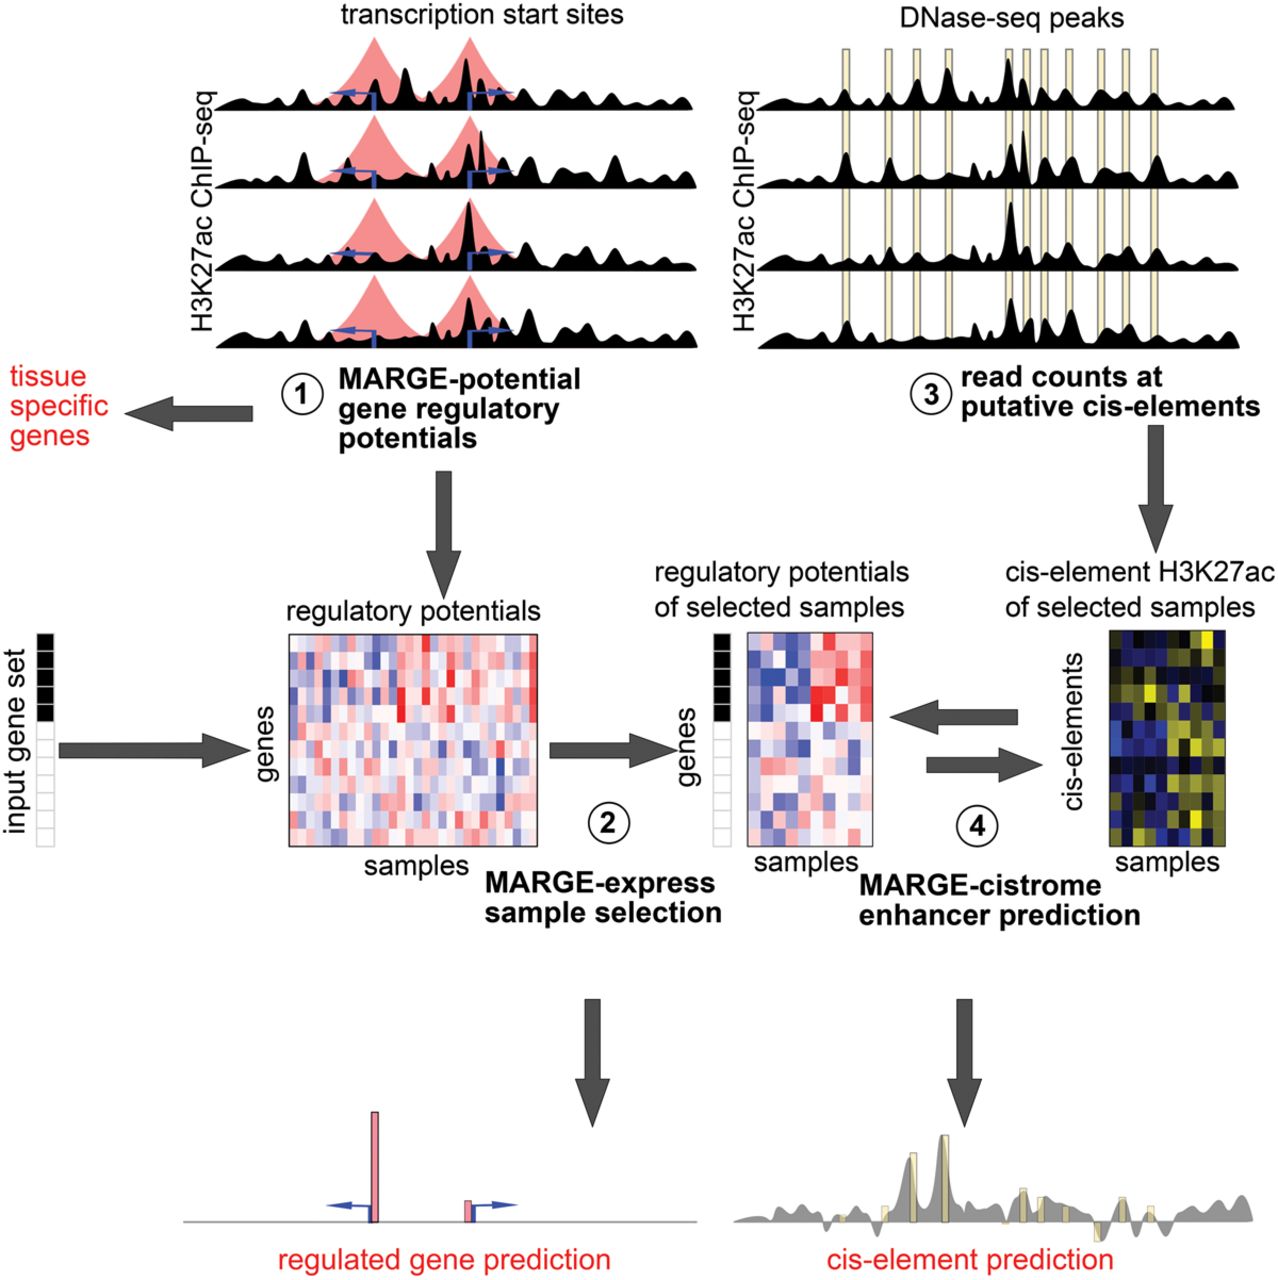
Schematic of MARGE framework. (1) MARGE-potential computes regulatory potentials from a compendium of H3K27ac ChIP-seq profiles. (2) MARGE-express uses stepwise regression to select a subset of informative H3K27ac ChIP-seq samples for the prediction of a user-provided input gene set. This regression selects columns (samples) from the matrix of normalized and centered regulatory potentials, represented as a blue-red heat map. MARGE produces a prediction of regulated genes that may include information on transcripts not included in the original gene expression study. (3) H3K27ac read counts in 1-kb regions centered on a list of DNase I-hypersensitive sites are extracted from the selected samples and assembled as a matrix of normalized and centered values, represented as a blue-yellow heat map. (4) MARGE-cistrome uses a semisupervised method to infer transcription factor binding sites from H3K27ac read counts at DNase I-hypersensitive sites (blue-yellow heat map), regulatory potentials (blue-red heat map), and the input gene set. MARGE-cistrome produces predictions of the cistrome of TFs that are responsible for the regulation of the gene set.


