
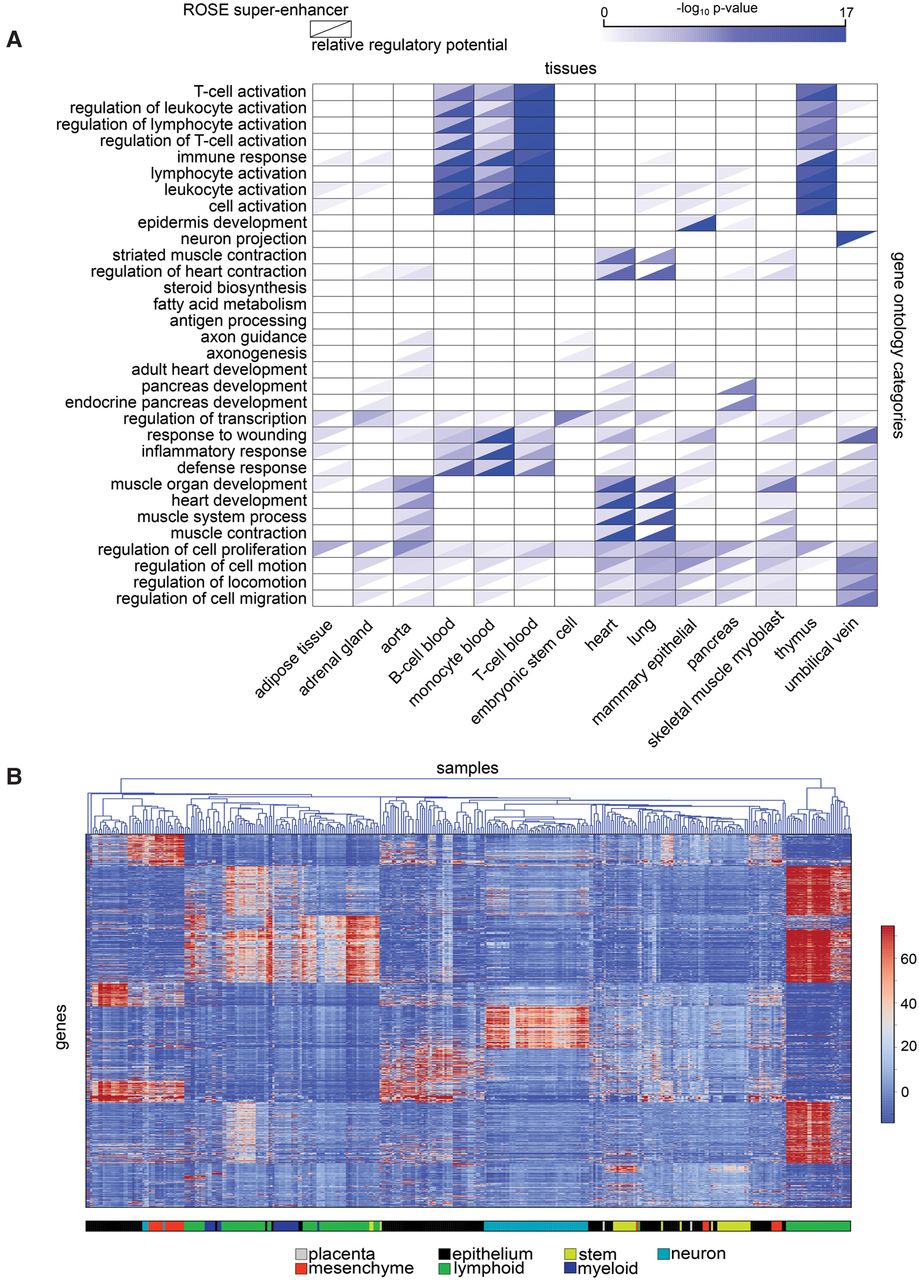
Regulatory potentials in the identification of key tissue-specific genes. (A) Gene ontology analysis of the genes with the highest relative regulatory potential (lower right triangles) in a variety of cell types shows functional enrichment to correspond with the known function of the different cell types. The pattern of enrichment of ROSE superenhancer-associated genes (upper left triangles) shows these genes to be less enriched in several tissue-specific gene categories and more enriched in some more generic categories, for example, “regulation of transcription.” (B) The regulatory potentials in diverse cell types cluster in a way that is mostly consistent with cell types. Known regulators of several cell types can be clearly identified through regulatory potential analysis.


