
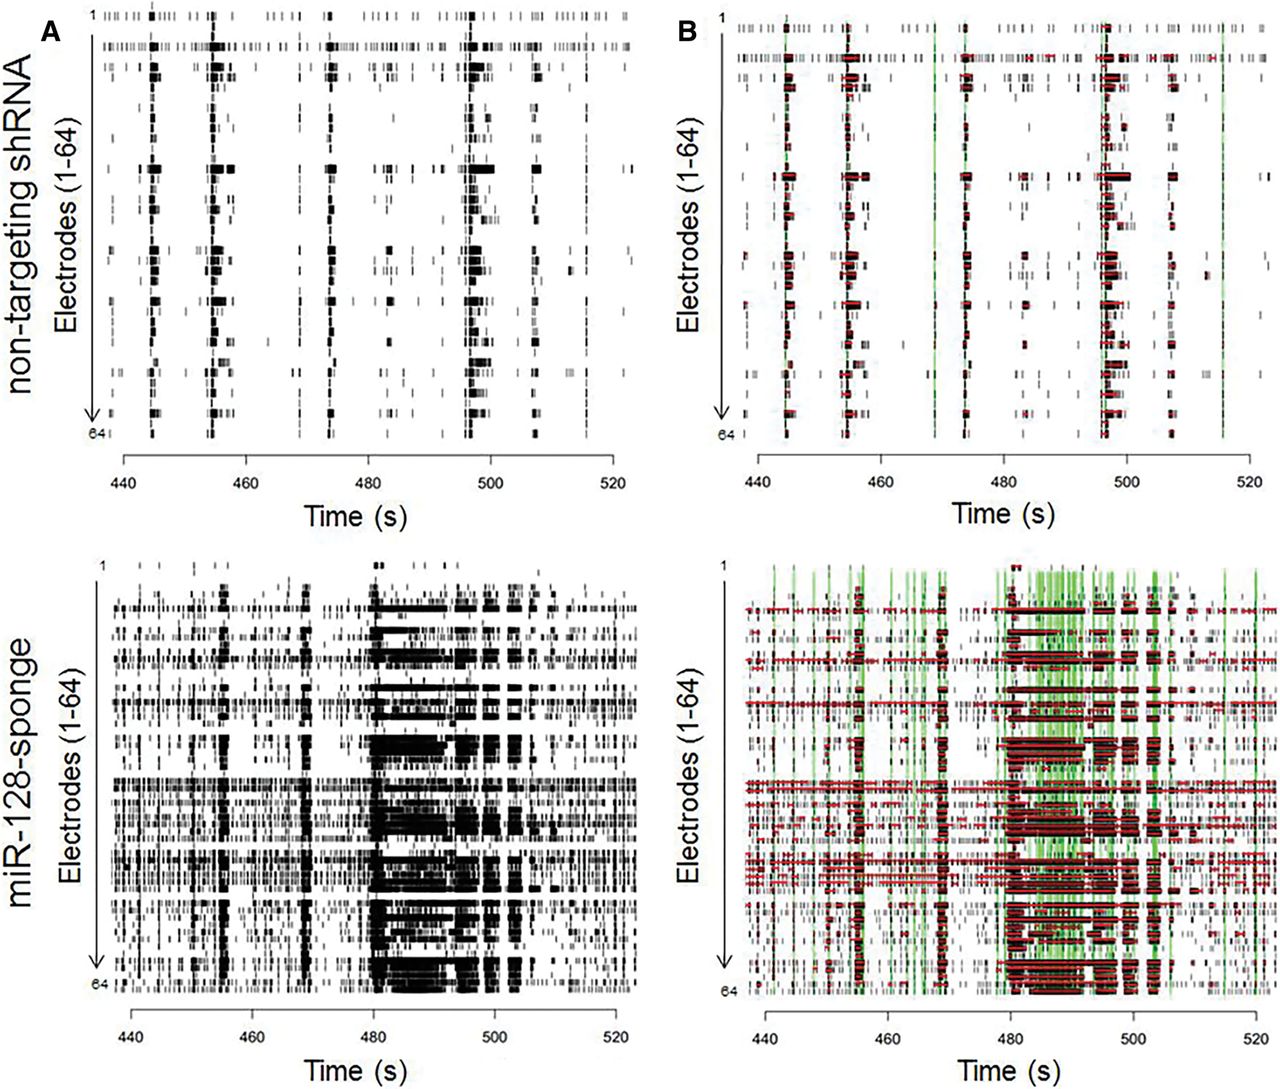
Figure 4.
Raster plot illustrating network organization. (A) miR-128 knockdown results in short bursts with increased number of spikes per burst (bottom panel). (B) Increased burst activity is depicted with red horizontal bars and increased network events, including network spikes and network bursts, in green vertical bars. This raster plot depicts activity from 440–520 sec during the 15-min recording on DIV12 of a single representative control and miR-128 knockdown well.


