
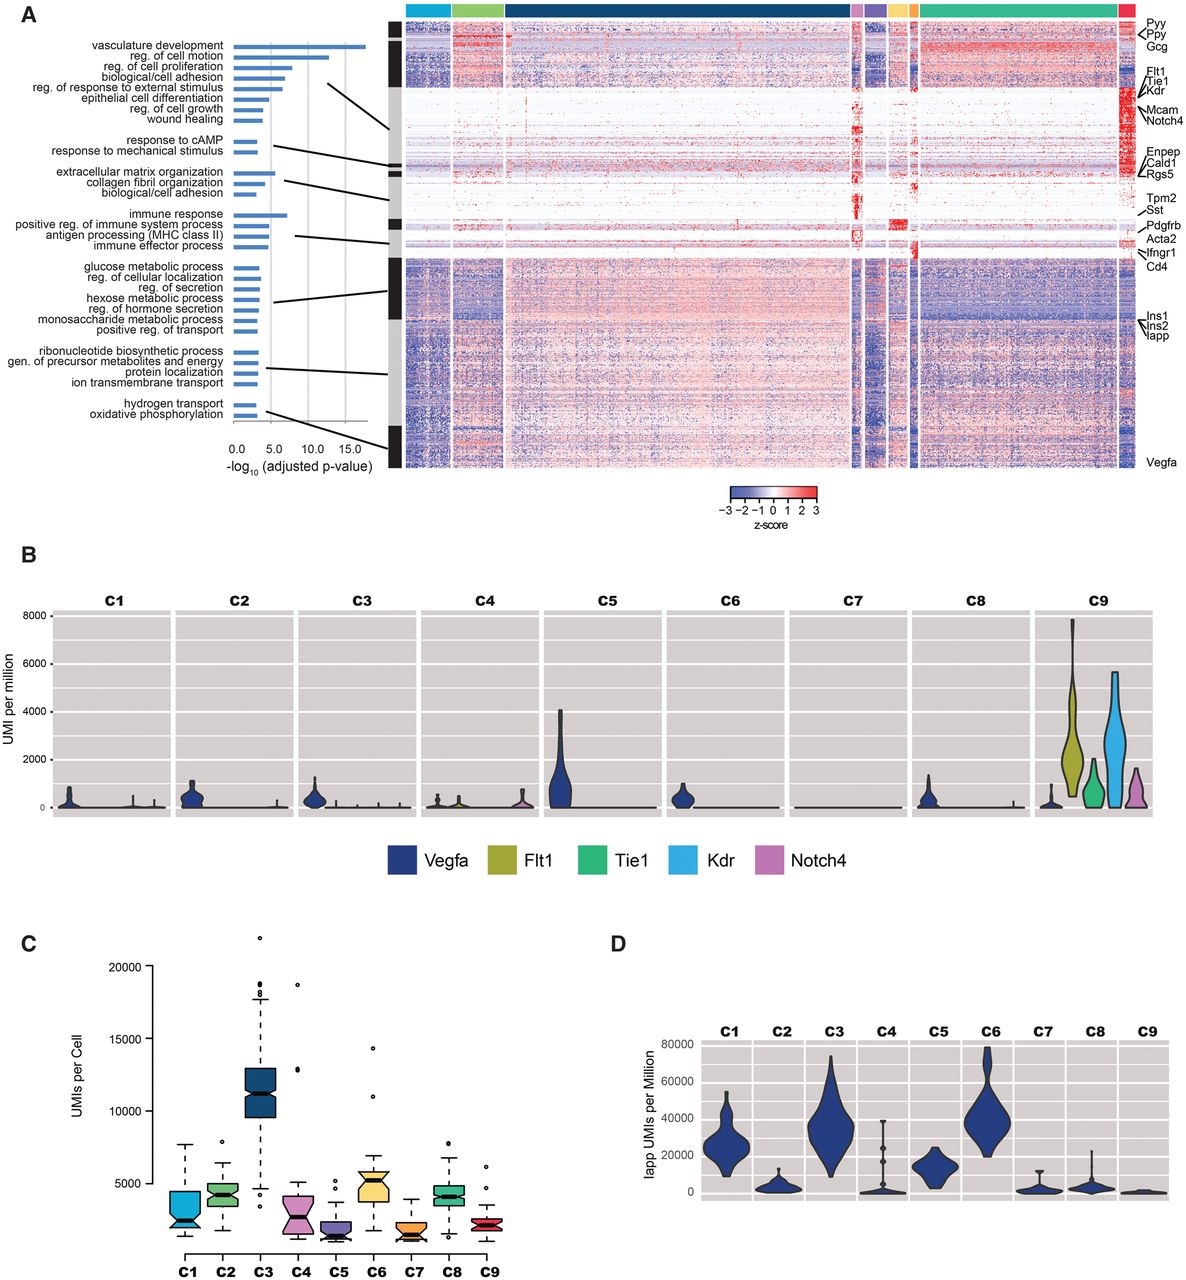
Classification of 1000 islet cells. (A) Hierarchical clustering of the 940 genes that are differentially expressed between any pair of the nine-cell clusters. Gray and black rectangles indicate major gene clusters identified by hierarchical clustering, and Gene Ontology terms significantly enriched (adjusted P-value <0.001) for each group are indicated (data available in Supplemental Table S3). Each of the cell clusters (same order and color as in Fig. 5B) are indicated by the rectangles at the top of the figure. Hand-picked genes of interest are highlighted at the right of the figure. (B) Violin plot showing Vegfa expression and that of its receptors. (C) Boxplots showing the differences in the distribution of total UMIs per cell for each of the cell clusters. (D) Violin plots showing the normalized expression of amylin (Iapp) in UMIs per million across the cells in each cluster.


