
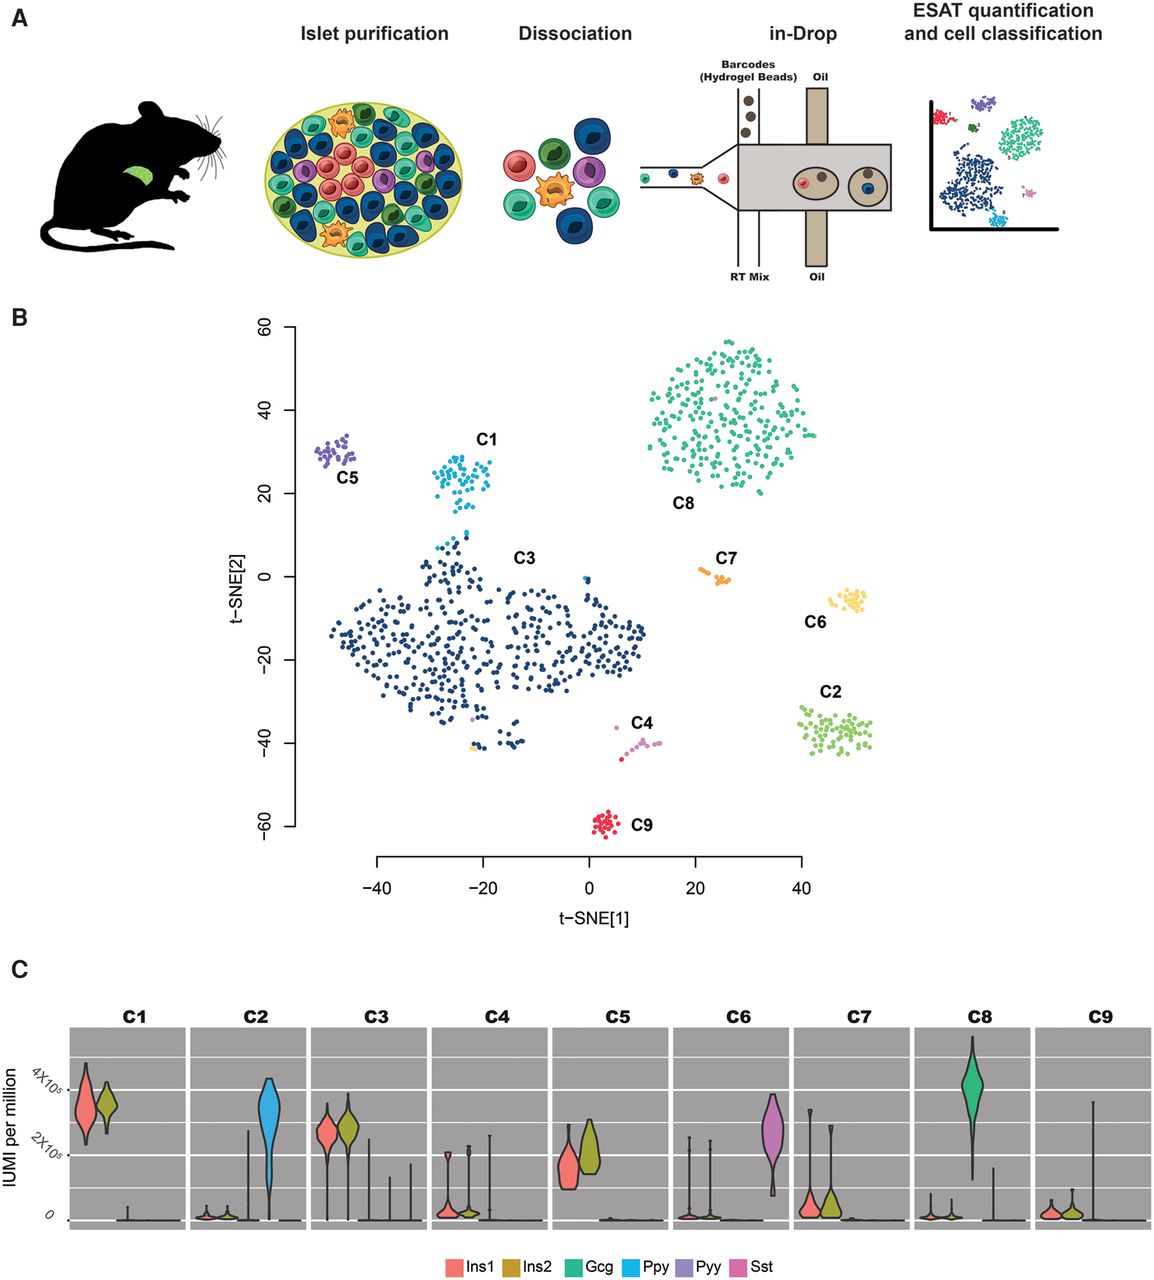
Figure 5.
Single-cell analysis of rat pancreatic islets. (A) Summary of the study. (B) Two-dimensional view of a nine-component independent component analysis (ICA) projection using t-distributed stochastic neighbor embedding (t-SNE). Cells are colored according the clusters obtained after spectral clustering (Methods) of the nine-component ICA projection. (C) Violin plots showing the distribution of hormone expression across cells in each cluster.


