
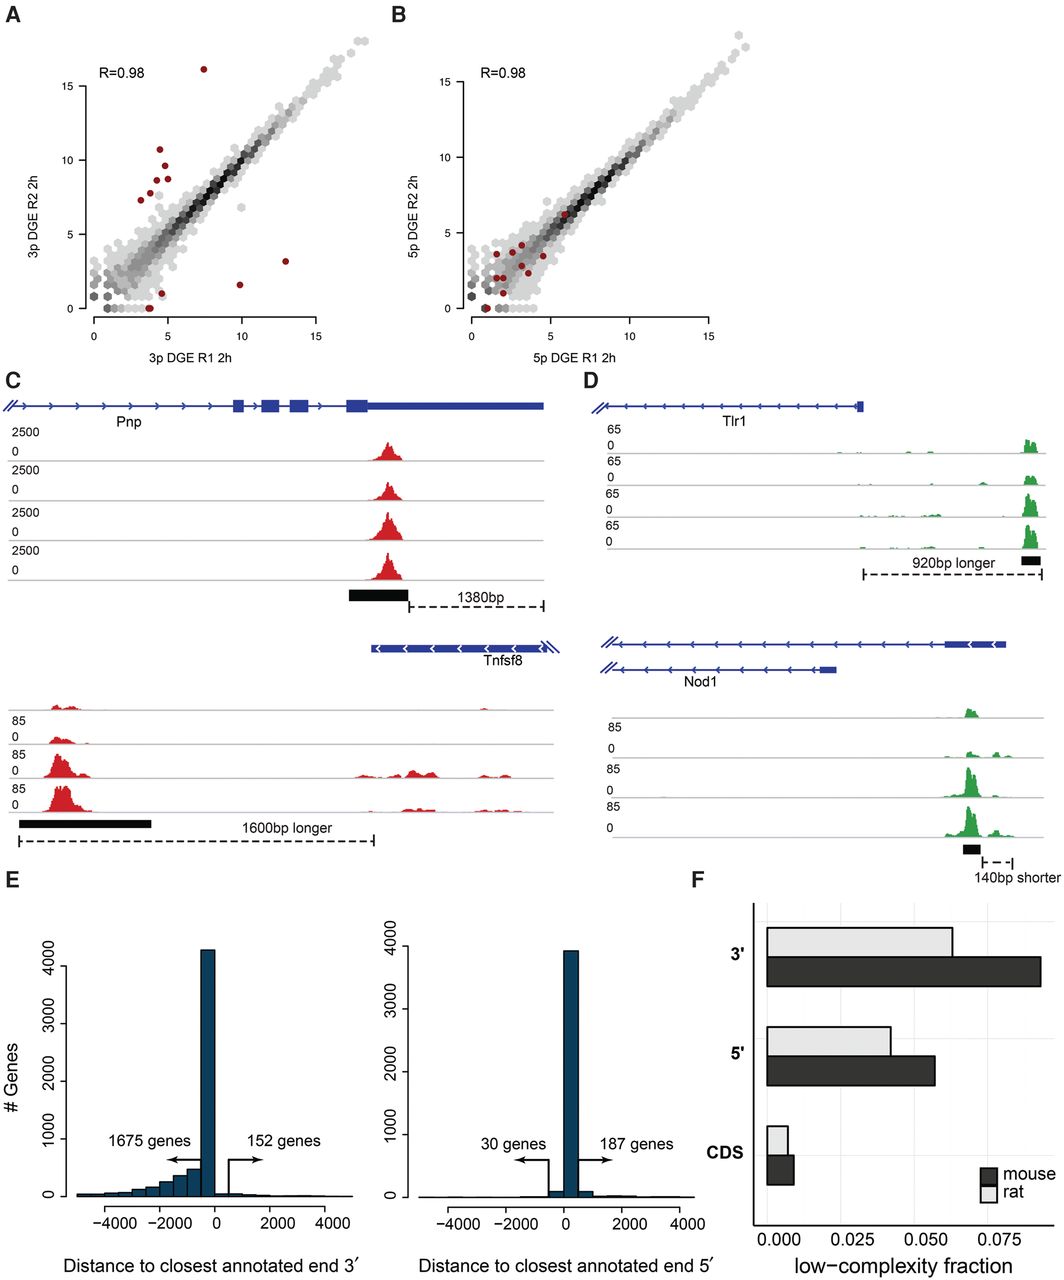
Common problems in end-sequence analysis. (A,B) Scatter plots of gene expression computed from 3′ (A) and 5′ (B) libraries made from technical replicates of mouse bone marrow–derived dendritic cells (mBMDCs) 2 h after LPS stimulation. Red dots highlight outliers (at least 10-fold difference between replicates in 3′ libraries). (C,D) Examples of annotated TSSs and TTSs that do not correspond to observed start and end sites in our samples. Read coverage is normalized to library size. (E) Distance from the most highly enriched window within each gene to the annotated TTS for the 2-h 3′ library (left) and to the TSS for the 5′ library (right). (F) Fraction of repetitive sequence in 3′ UTRs, 5′ UTRs, and coding sequence (CDS) as estimated by RepeatMasker, downloaded from the UCSC Genome Browser (Smit et al. 2004; Rosenbloom et al. 2015), in mouse (black) and rat (gray) annotated genes.


