
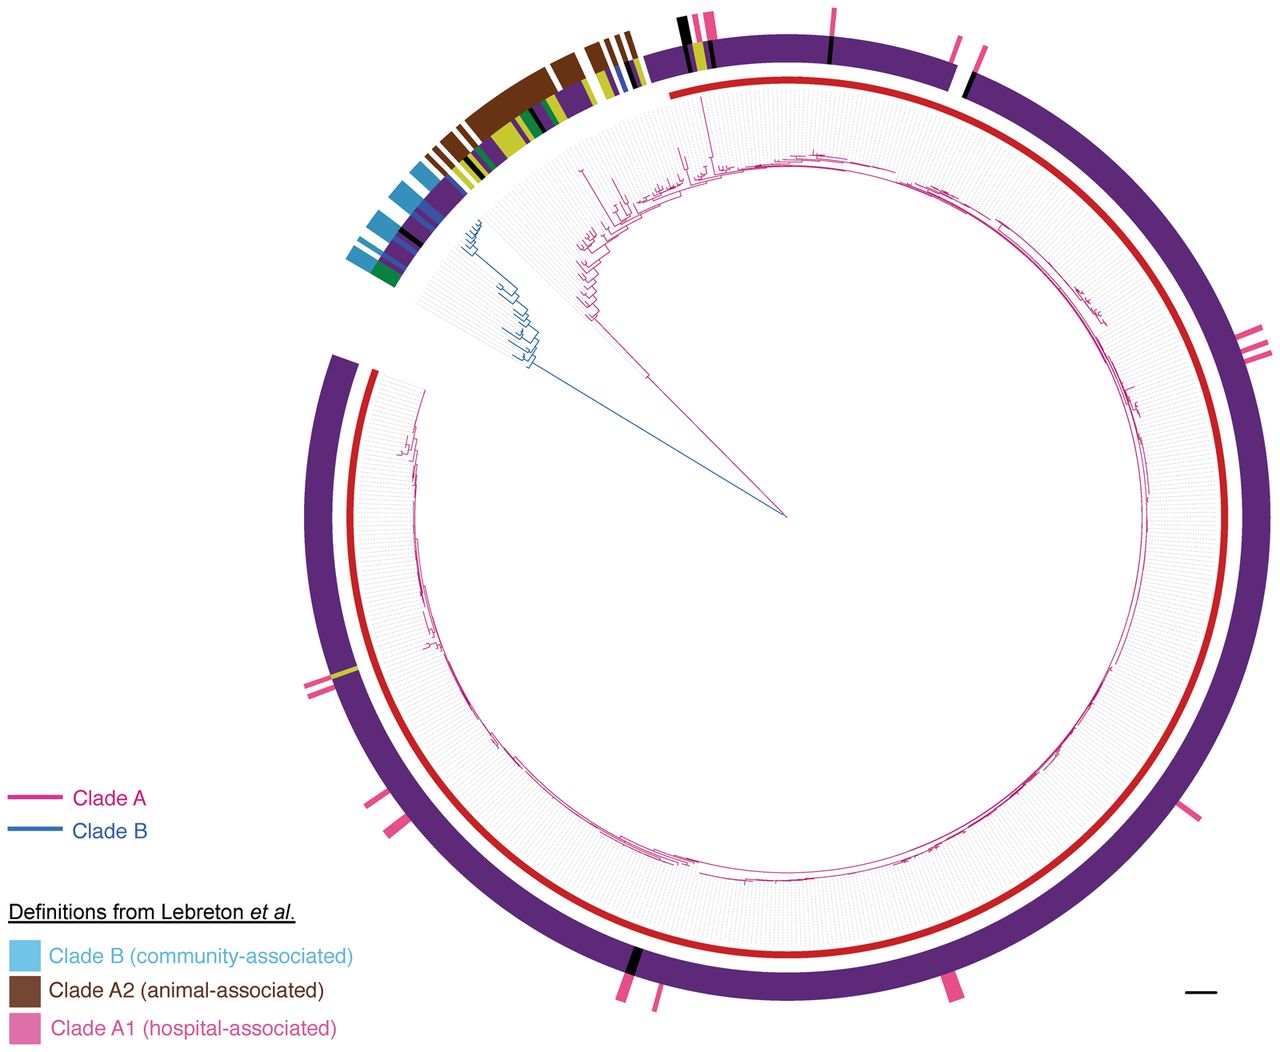
Population structure of E. faecium. Maximum likelihood tree based on SNPs in the 1288 genes core to the 506 isolates from this study and 73 isolates reported by Lebreton et al. (2013). Pink branches indicate Clade A; blue branches, Clade B. Inner incomplete red ring denotes the clonal expansion of Clade A. Middle ring shows the isolate source (yellow, animal; purple, clinical; blue, nonhospital; black, hospital-associated feces/surveillance/outbreak/unknown; green, other; white, unknown). Outer ring shows isolates from Lebreton et al. (2013) colored by the clade to which they were originally assigned (pink, Clade A1; brown, Clade A2; blue, Clade B; black, hybrid Clade A1/B). Scale bar, 9593 SNPs.


