
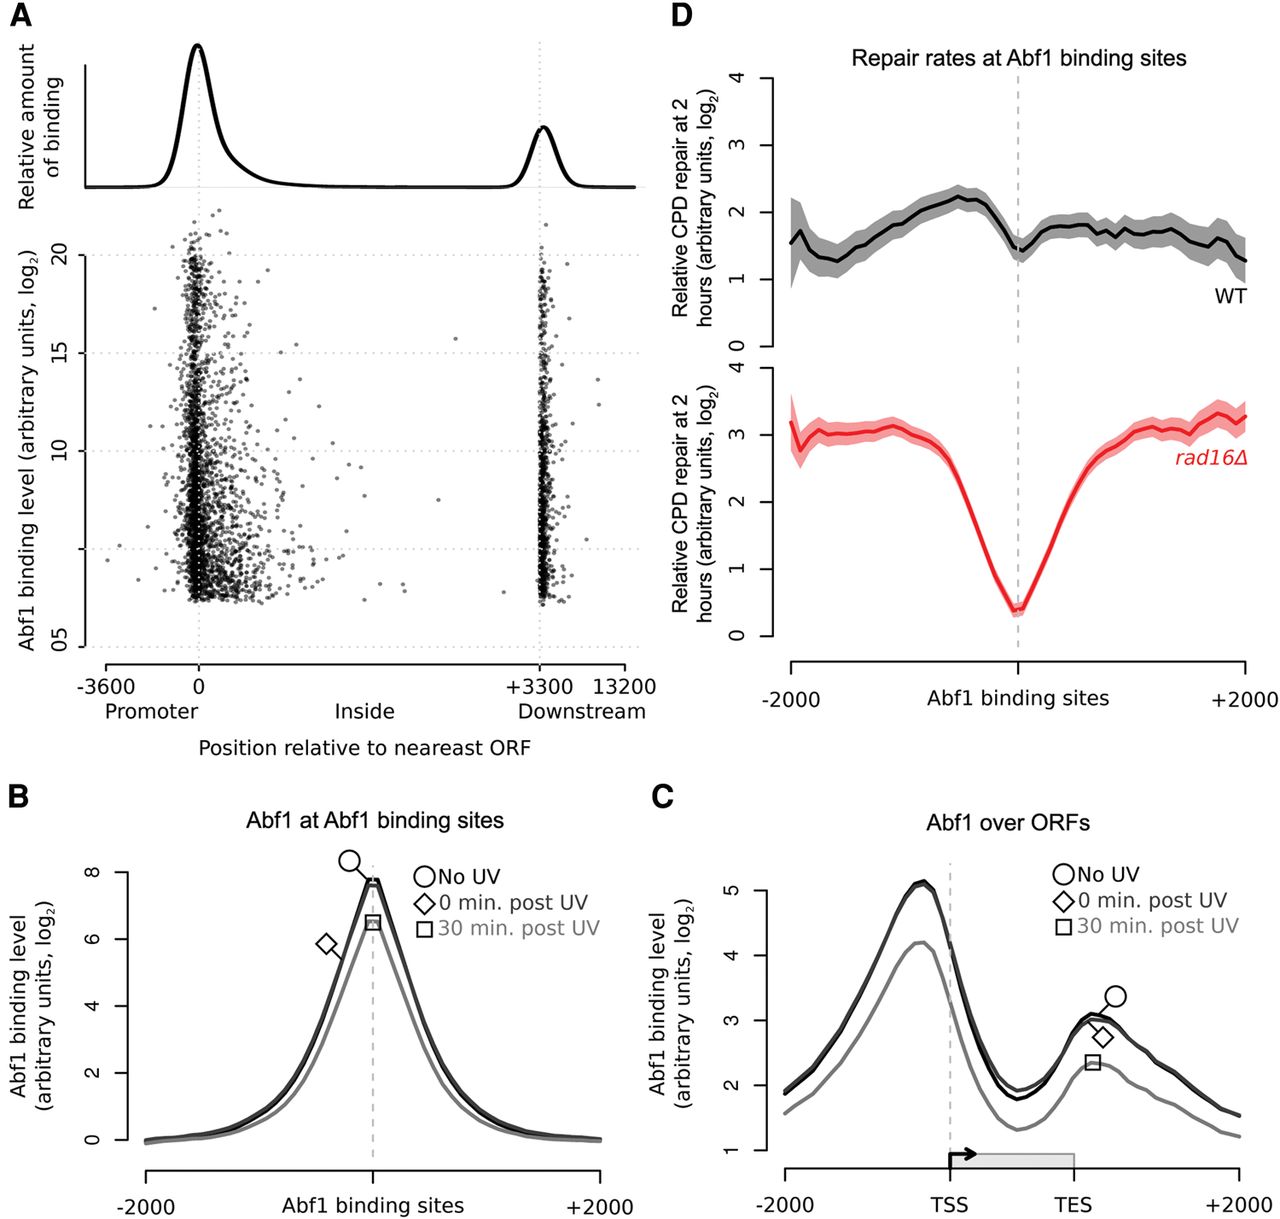
GG-NER is organized from Abf1 binding sites, and Abf1 occupancy does not change significantly in response to UV. (A) The positions of Abf1 binding relative to ORFs. Abf1 binding levels at the ∼3800 detected binding sites are shown. Each binding site is represented by a single data point, with the overall relative amount of binding throughout the region shown above. (B) ChIP-chip data for Abf1 binding. Data are shown for unirradiated (black, circle), 0 min post-UV (dark gray, diamond), and 30 min post-UV (light gray, square) cells. Solid lines show the means of three data sets per time point. (C) As in B, plotted around ORF structure. (D) Relative CPD repair rates around Abf1 binding sites. The data depicted in Figure 1C are used here to plot the relative rates of CPD removal around Abf1 binding sites in wild-type (black) and rad16Δ cells (red). Solid lines show mean CPD repair rates in wild-type (n = 3, black line) and rad16Δ cells (n = 2, red line). The shaded areas show the SEM and SD, with CPD levels plotted as arbitrary units on the y-axis.


