
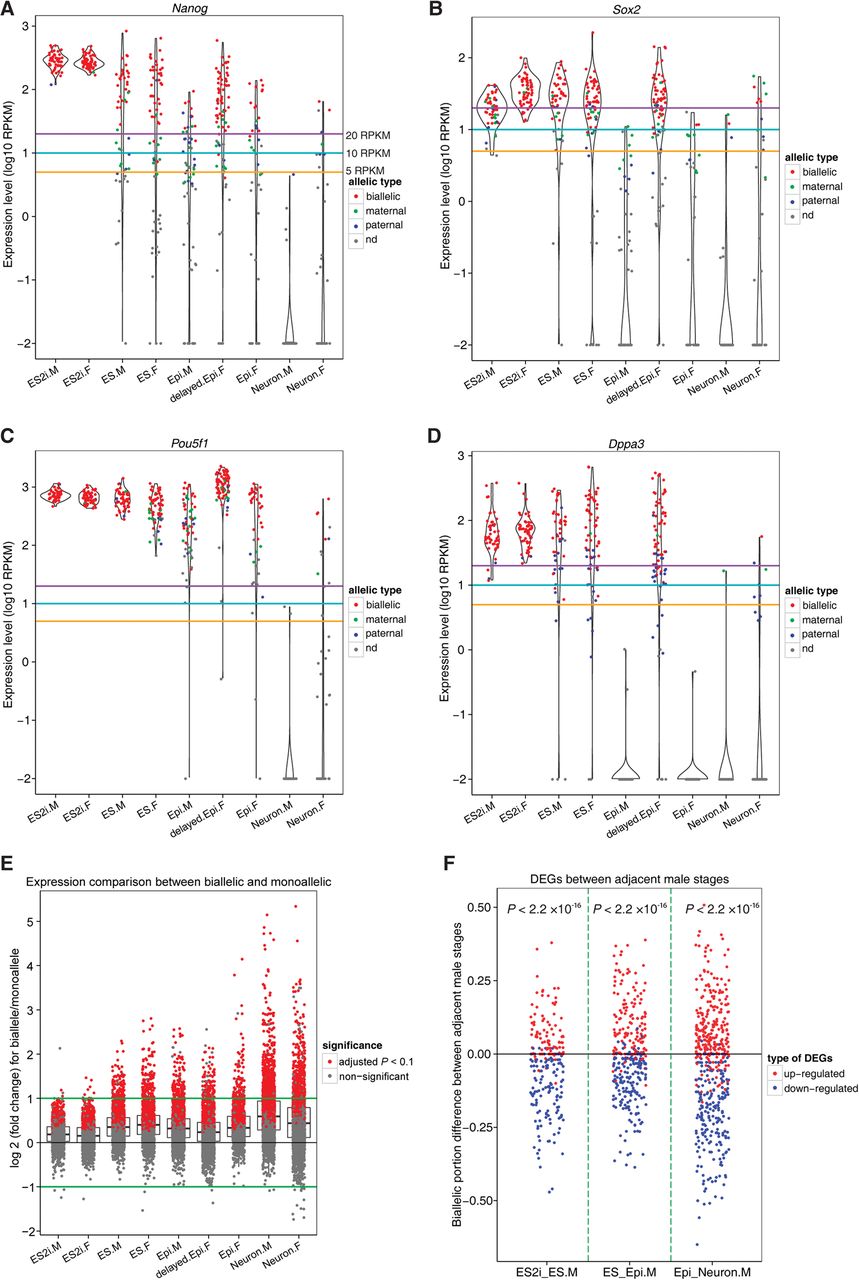
Allelic expression of pluripotency genes and contribution of allelic composition to differential expression. (A–D) Allelic expression profile for pluripotency genes Nanog, Sox2, Pou5f1, and Dppa3. Gold, cyan, and purple lines indicate the expression levels of 5, 10, and 20 RPKM. (E) Expression level comparison for each gene between biallelic and monoallelic fashions. Only those autosomal genes that are expressed at 20 or more RPKM in cell types with five or more bialleles and five or more monoalleles were considered. Student's t-test was applied to examine whether expression level of genes in a biallelic way was significantly higher than that in a monoallelic way. (F) Relationship between biallelic expression and up-/down-regulated genes between two adjacent male stages. X-axis denotes the comparing groups: ES2i versus ES, ES versus Epi, and Epi versus Neuron. Y-axis represents the biallelic fraction difference of cells between two comparing groups. Exact binomial test was applied to check the significance. Only those autosomal genes with expression level of 20 or more RPKM in at least 60% of a given cell type were considered. (M) male; (F) female; (nd) not detected.


