
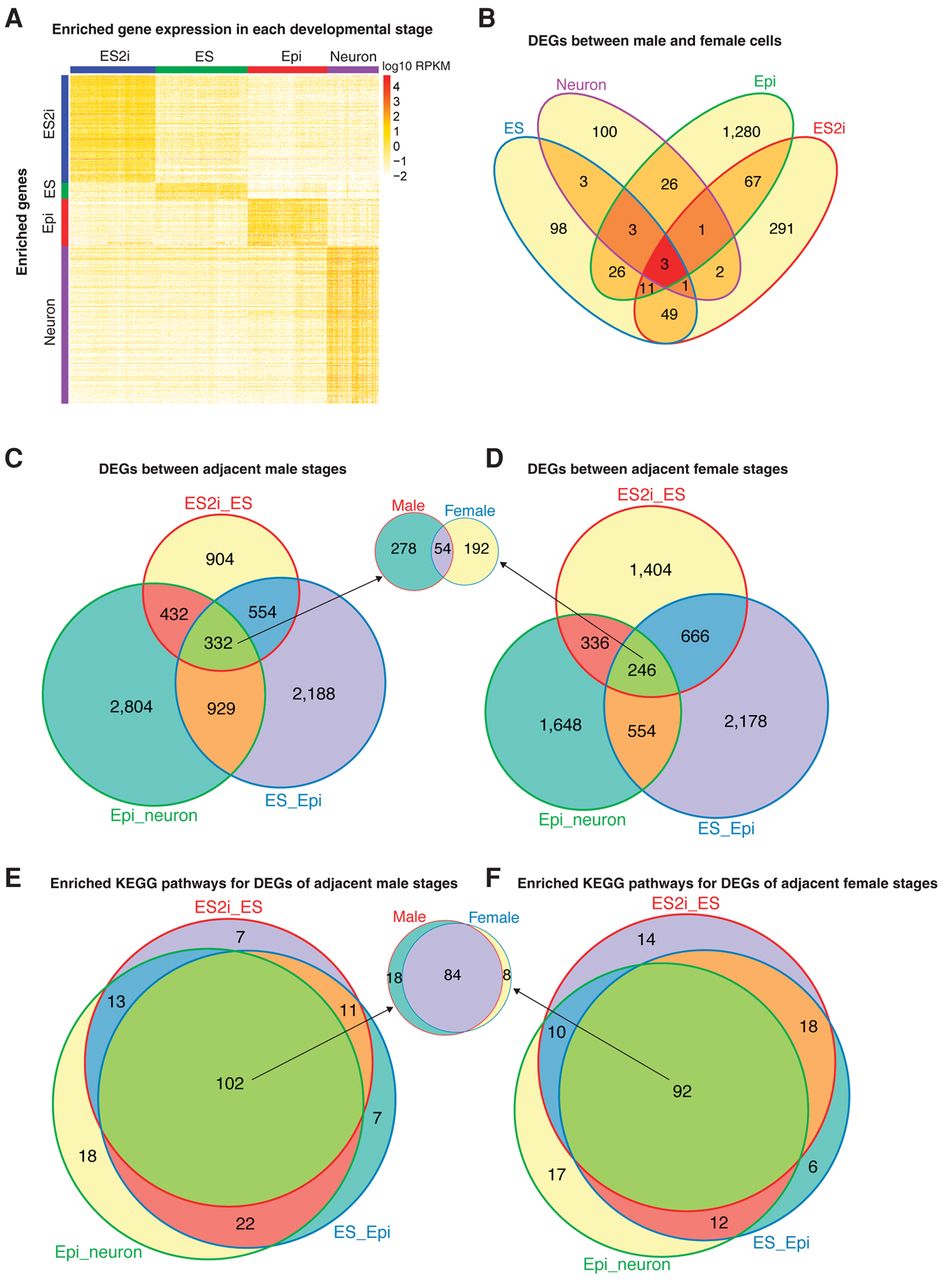
Differential gene expression analysis across developmental states. (A) Enriched gene expression profile in each developmental state. For the Epi condition, Epi.F cells but not delayed.Epi.F cells were used in order to match the developmental state. One-way ANOVA pairwise comparison was applied to the normalized gene expression of different conditions (including both male and female cells) to identify genes with enriched expression. Cutoff: fold change >4 and adjusted P < 0.01. (B) Differentially expressed genes between male and female cells among distinct conditions. (C,D) Differentially expressed genes between adjacent male/female states. (E,F) Enriched KEGG pathways for the DEGs of adjacent male/female states.


