
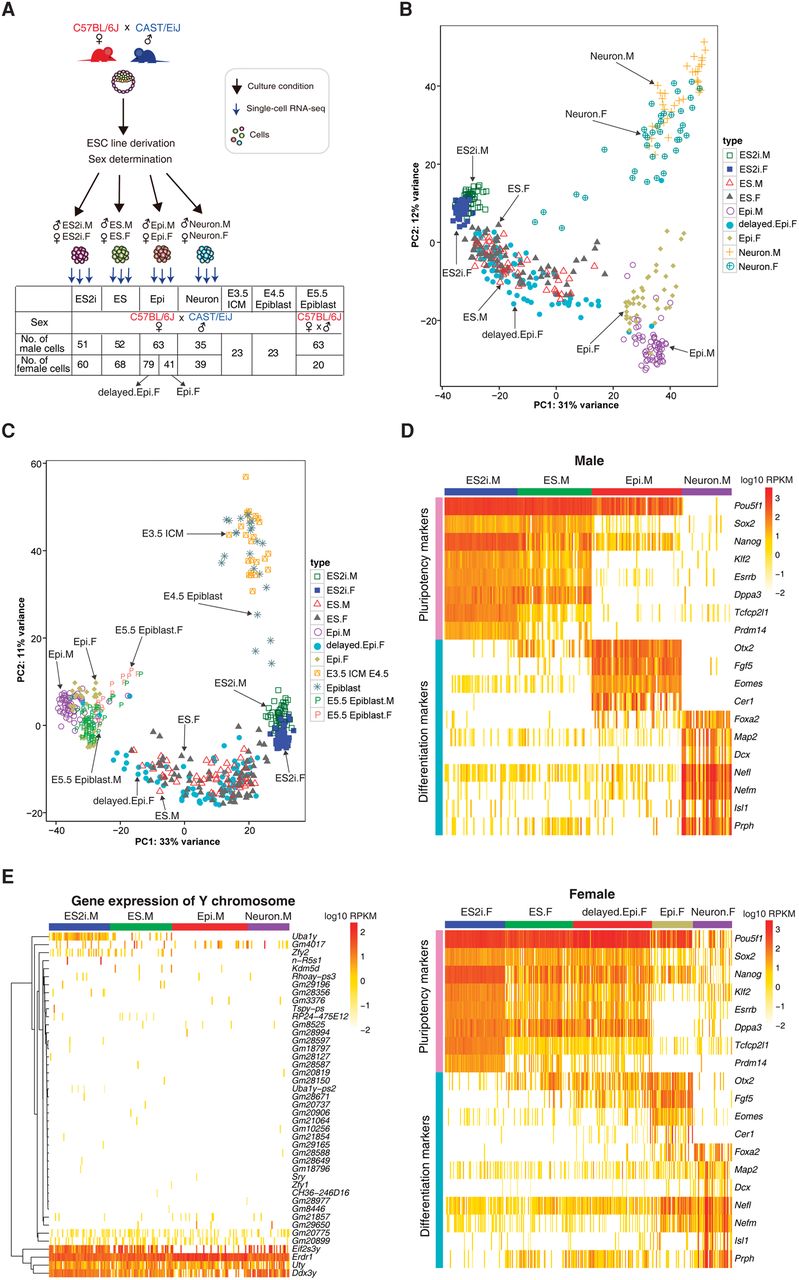
Figure 1.
Gene expression profile of in vitro and in vivo mouse embryonic cells. (A) Experimental design of this study: (ICM) inner cell mass. (B) PCA of the cultured embryonic stem cells based on the top 500 variable genes. (C) PCA of cultured, preimplantation (E3.5 ICM and E4.5 epiblast) and post-implantation (E5.5 epiblast) embryonic cells based on the top 500 variable genes. (D) Expression profile of pluripotency and differentiation genes in different conditions for male and female cells (upper and lower panels, respectively). (E) Y Chromosome gene expression across all male cells. (M) male; (F) female.


